Dominik Kos, Kristina Skufca
DATA ENGINEERS
Previous blog post fom Data Catalog series:
Data Catalog
Introduction
This is the second part of a multi-part series where we will be discussing the topics surrounding Data Catalogs. In this post, we will be covering the testing of existing Data Catalog solutions, and how well they comply with the requirements deemed necessary for a potential Data Catalog, which we could then plug into our working environment or further build upon.
Data Catalogs have become a very popular term in the world of data, and they are one of the few things that all big cloud providers, such as GCP, AWS, and Azure, have in common. There are numerous commercial and open-source Data Catalogs out there, just waiting to be discovered by you or your company.
Considering that we would like to implement one within our company as well, our team set out to test out those numerous solutions. Since many commercial Data Catalogs can cost a pretty penny, even just for testing purposes, we decided to find an open-source solution that would potentially have a good basis of connectors and other features such as Data Profiling, Business Glossary, Automation, Access Management, and Data Lineage, upon which we could then build further features, tailored to our specific needs.
After doing extensive research, finding all potential candidates, and cross-referencing the pros and cons of each one, the following three were selected to be tested: Magda, Amundsen, and OpenMetadata.
Magda
Magda is a Data Catalog system that will provide a single place where all of an organization’s data can be catalogued, enriched, searched, tracked and prioritized – whether big or small, internally or externally sourced, available as files, databases or APIs. Magda is designed specifically around the concept of the federation – providing a single view across all data of interest to a user, regardless of where the data is stored or where it was sourced from. The system is able to quickly crawl external data sources, track changes, make automatic enhancements and send notifications when changes occur, giving data users a one-stop shop to discover all the data that’s available to them.
Magda is an open-source catalog, licensed under the Apache License 2.0, and can be found on GitHub. Currently it is under development by a small team, which makes the documentation and the support poor. We tried our best to test it but ran into several issues and eventually had to postpone further research of the Magda Data Catalog. We shifted our focus to the catalogs we had greater success with.
Amundsen
Introduction
Amundsen is a data discovery and metadata engine for improving the productivity of data analysts, data scientists and engineers when interacting with data. It does that by indexing data resources (tables, dashboards, streams, etc.) and powering a page-rank style search based on usage patterns (e.g. highly queried tables show up earlier than less queried tables).
It is important to note here that it is currently not being presented to the wider audience as a complete Data Catalog solution. It works on the ETL principle wherein data is primarily extracted from the various sources, then is transformed if necessary, and loaded onto the necessary services.
Architecture
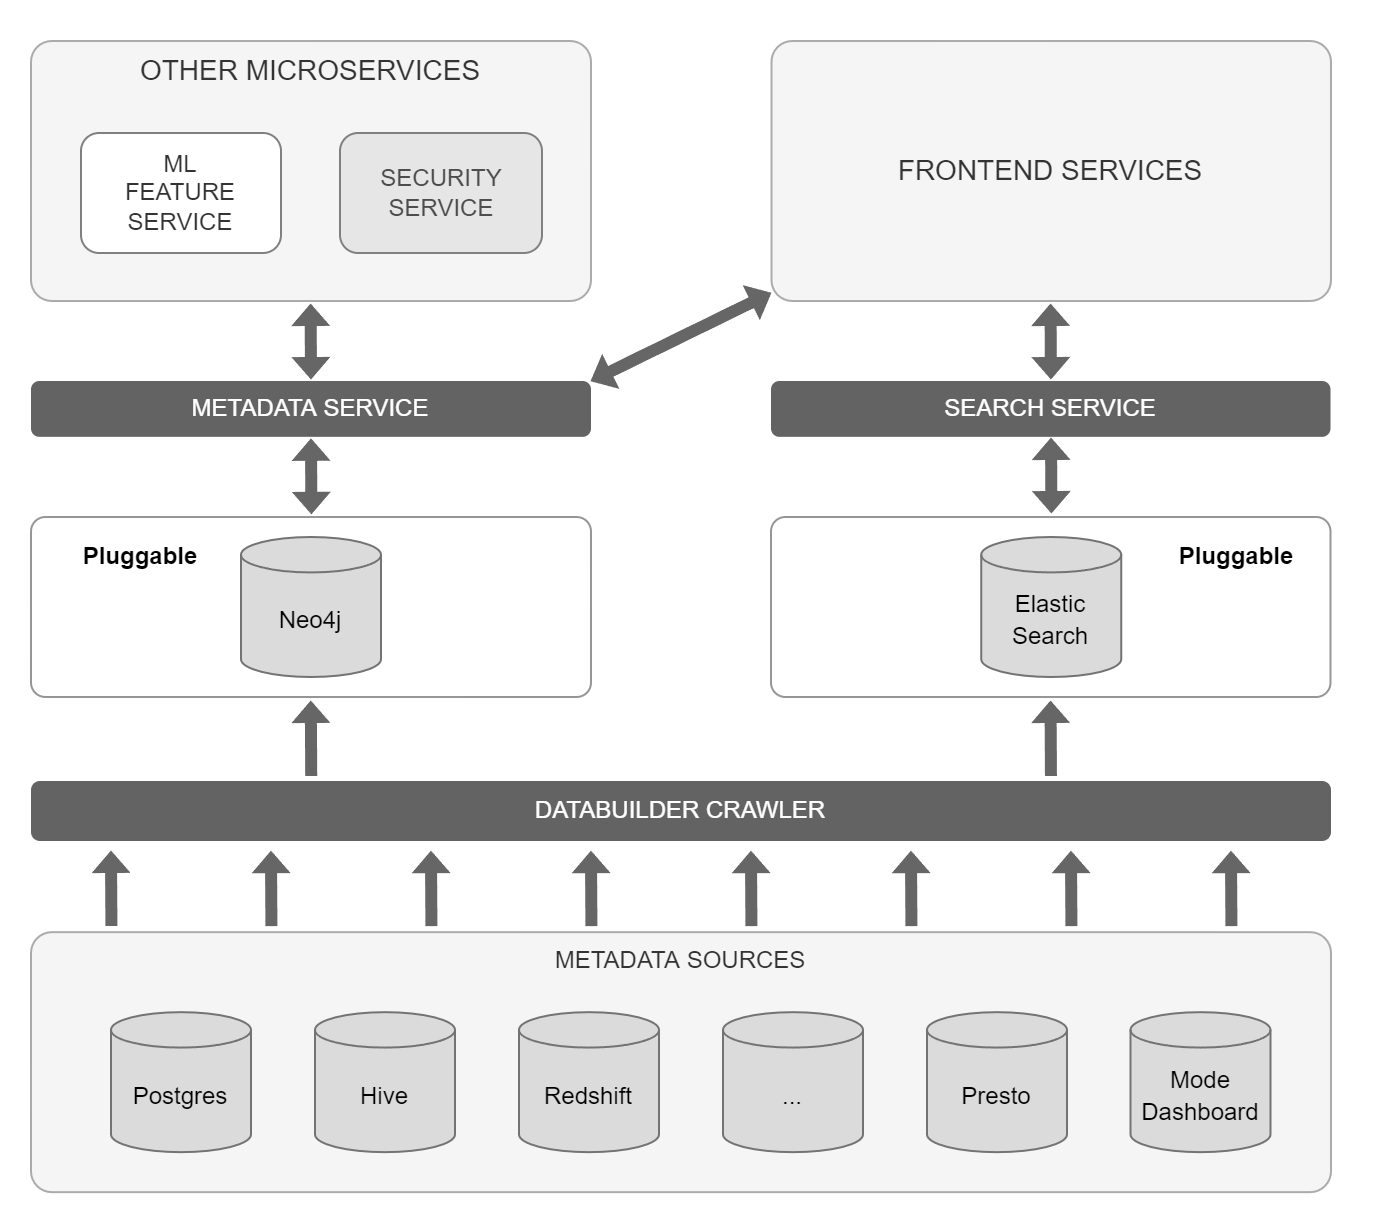
Figure 1 below displays its architecture:
Figure 1: Amundsen Architecture (from Solving Data Discovery Challenges at Lyft with Amundsen, an Open-source Metadata Platform, timestamp 10:10)
The main parts of the architecture are the following five services:
- Frontend Service – Flask application with a React frontend where users can search through the fetched metadata as in a Data Catalog.
- Search Service – leverages Elastic Search for search capabilities, used to power frontend metadata searching.
- Metadata Service – leverages Neo4j (or Apache Atlas) as the persistent layer, to provide various metadata.
- Neo4j – graph database management system, used here to fetch and display the metadata from the Databuilder and provide it to the Metadata Service.
- Elastic Search – search engine based on the Lucene library whose API is here used to connect the metadata from the Databuilder to the Search Service.
These services start when Amundsen is run on our machine. One thing to keep in mind here is that even though each of these is its own service, they all start with the same YAML file, so each of them needs to be working properly to enable Amundsen to be hosted. This caused a lot of confusion for us in the beginning when we were not sure how they needed to be connected within the code to work correctly.
*It is important to note here is that the Neo4j can be replaced with Apache Atlas but that part has only been added in the recent releases, and it’s still a safer bet to use Neo4j instead.
The last important part of the architecture for us is the Amundsen Databuilder, Amundsens data ingestion library inspired by Apache Gobblin. Its purpose is to transport the data from all the different metadata sources (such as Postgres, Hive, BigQuery, GCS, etc.) to the Neo4j and Elastic Search services.
Connectors
In the case of Amundsen, the following four connectors were tested: BigQuery, Amazon Simple Storage Service (S3), Kafka, and Google Cloud Storage (GCS).
BigQuery
BigQuery already came as an out-of-the-box connector with Amundsen. In order to test it out the only thing that needed to be provided additionally were the Google Application Credentials.
S3
Just like BigQuery, S3 also came as an out-of-the-box connector with Amundsen. One important thing to point out here is the fact that the S3 connector relies on the preexisting AWS Data Catalog, also known as AWS Glue. So technically all the used metadata was previously fetched through AWS Glue, directly from S3, and then those results held in AWS Glue get propagated to our Amundsen services. The only thing that needed to be provided to the script to enable it to work properly were the necessary AWS Credentials.
Kafka
Unlike the previous connectors, in the case of Kafka, Amundsen does not come with an out-of-the-box connector. The only element of the entire ETL process provided is the Extractor, which was essentially just used to read messages from a Kafka topic on a certain Kafka cluster. Even-though some metadata can be held in the messages themselves, e.g. the structure of the data, the rest of the metadata that could potentially be provided through Kafka itself, e.g. metadata about the topics, cluster or the broker, was ignored. This meant that the rest of the ETL + Publishing process had to be created.
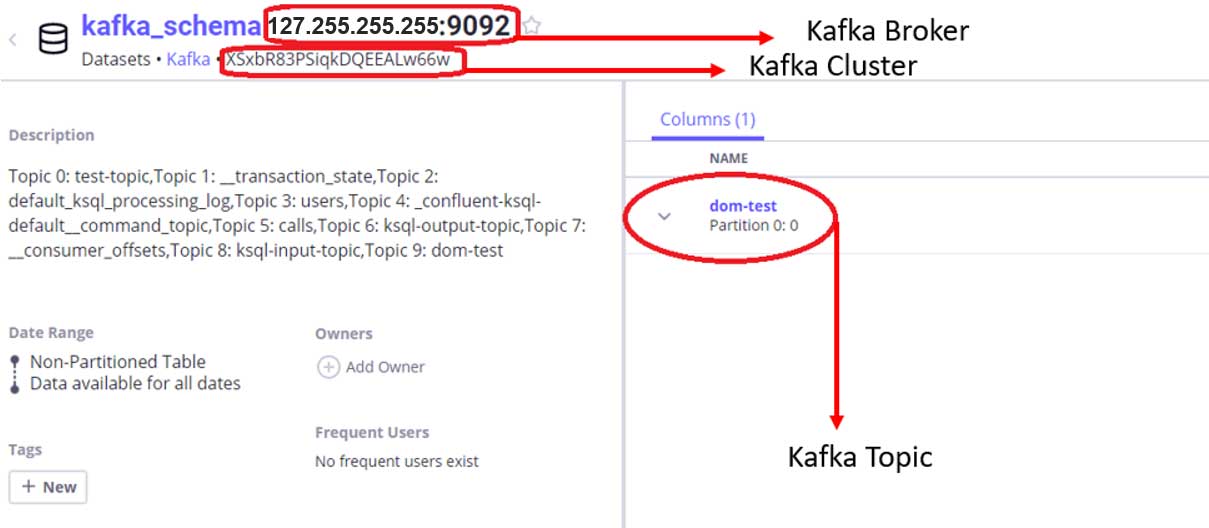
In the end, the newly created connector worked on a similar principle as the other ones. This entails that its results (metadata) were presented in tabular form. This meant that for some of the terms, Kafka equivalents had to be found. The list of these equivalents (substitutions) can be seen below:
- Datasets = Kafka Clusters
- Tables = Kafka Broker
- Columns = Kafka Topics
An example of this tabular form visualization in Amundsen can be seen in the following Figure:
Figure 2: Kafka Tabular Form in Amundsen
The last thing that needed to be added to enable Kafka to work properly were again the Google Application Credentials. This was due to the fact that the Kafka used for testing was run on a VM instance of one of our in-house GCP projects.
GCS
In the case of GCS, there were no glimpses of an existing connector anywhere to be found, even after an extensive and thorough research of the team. This meant that an entirely new connector had to be created for it. As opposed to Amazon’s S3 storage connector relying on its own Data Catalog, Glue, the decision was to try and create a connector for GCS that would directly fetch metadata from GCS, without the need to go through the Google Cloud Data Catalog first.
This appeared to work fine, and the last thing that again needed to be provided to enable the connector fully were the Google Application Credentials.
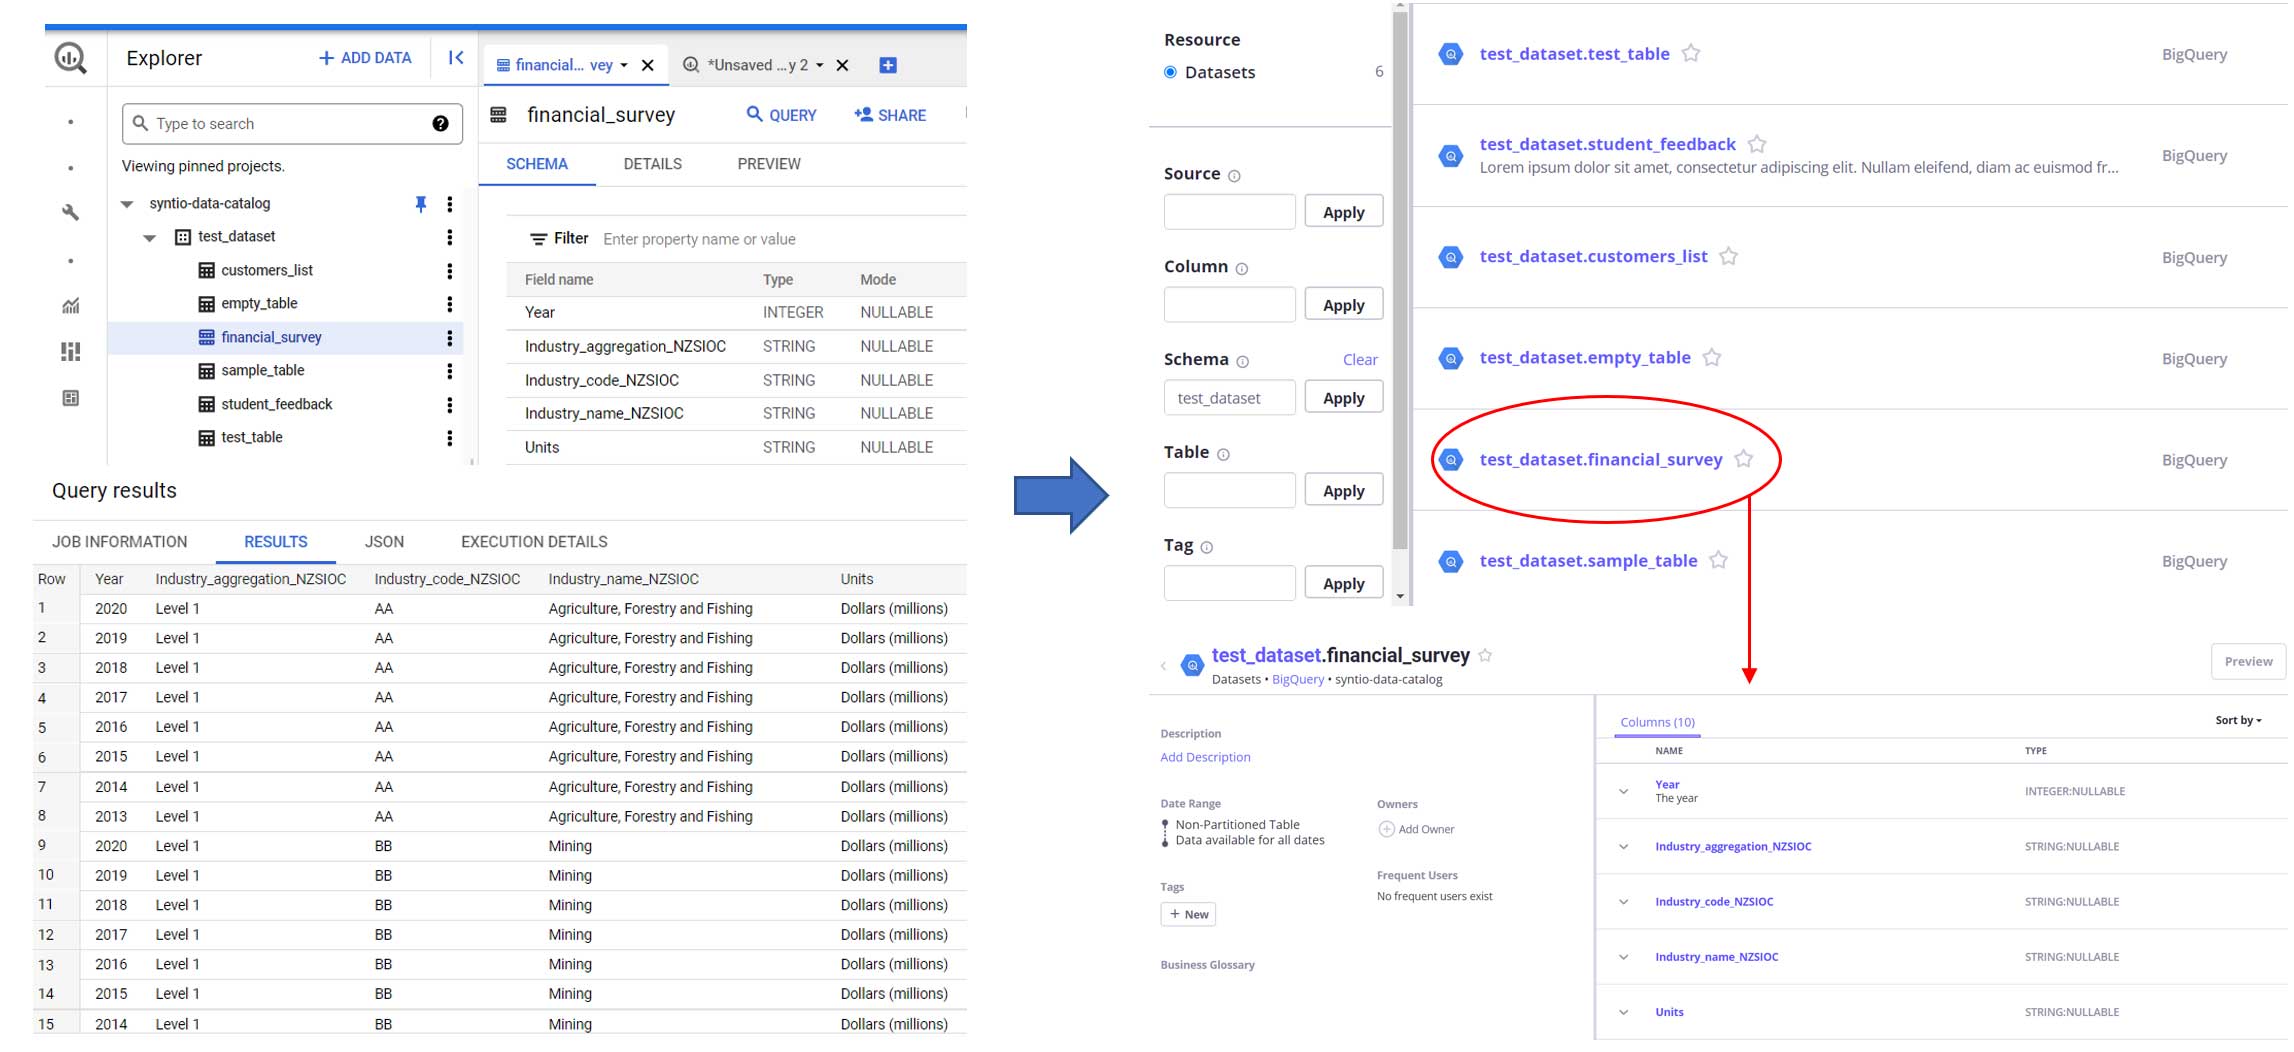
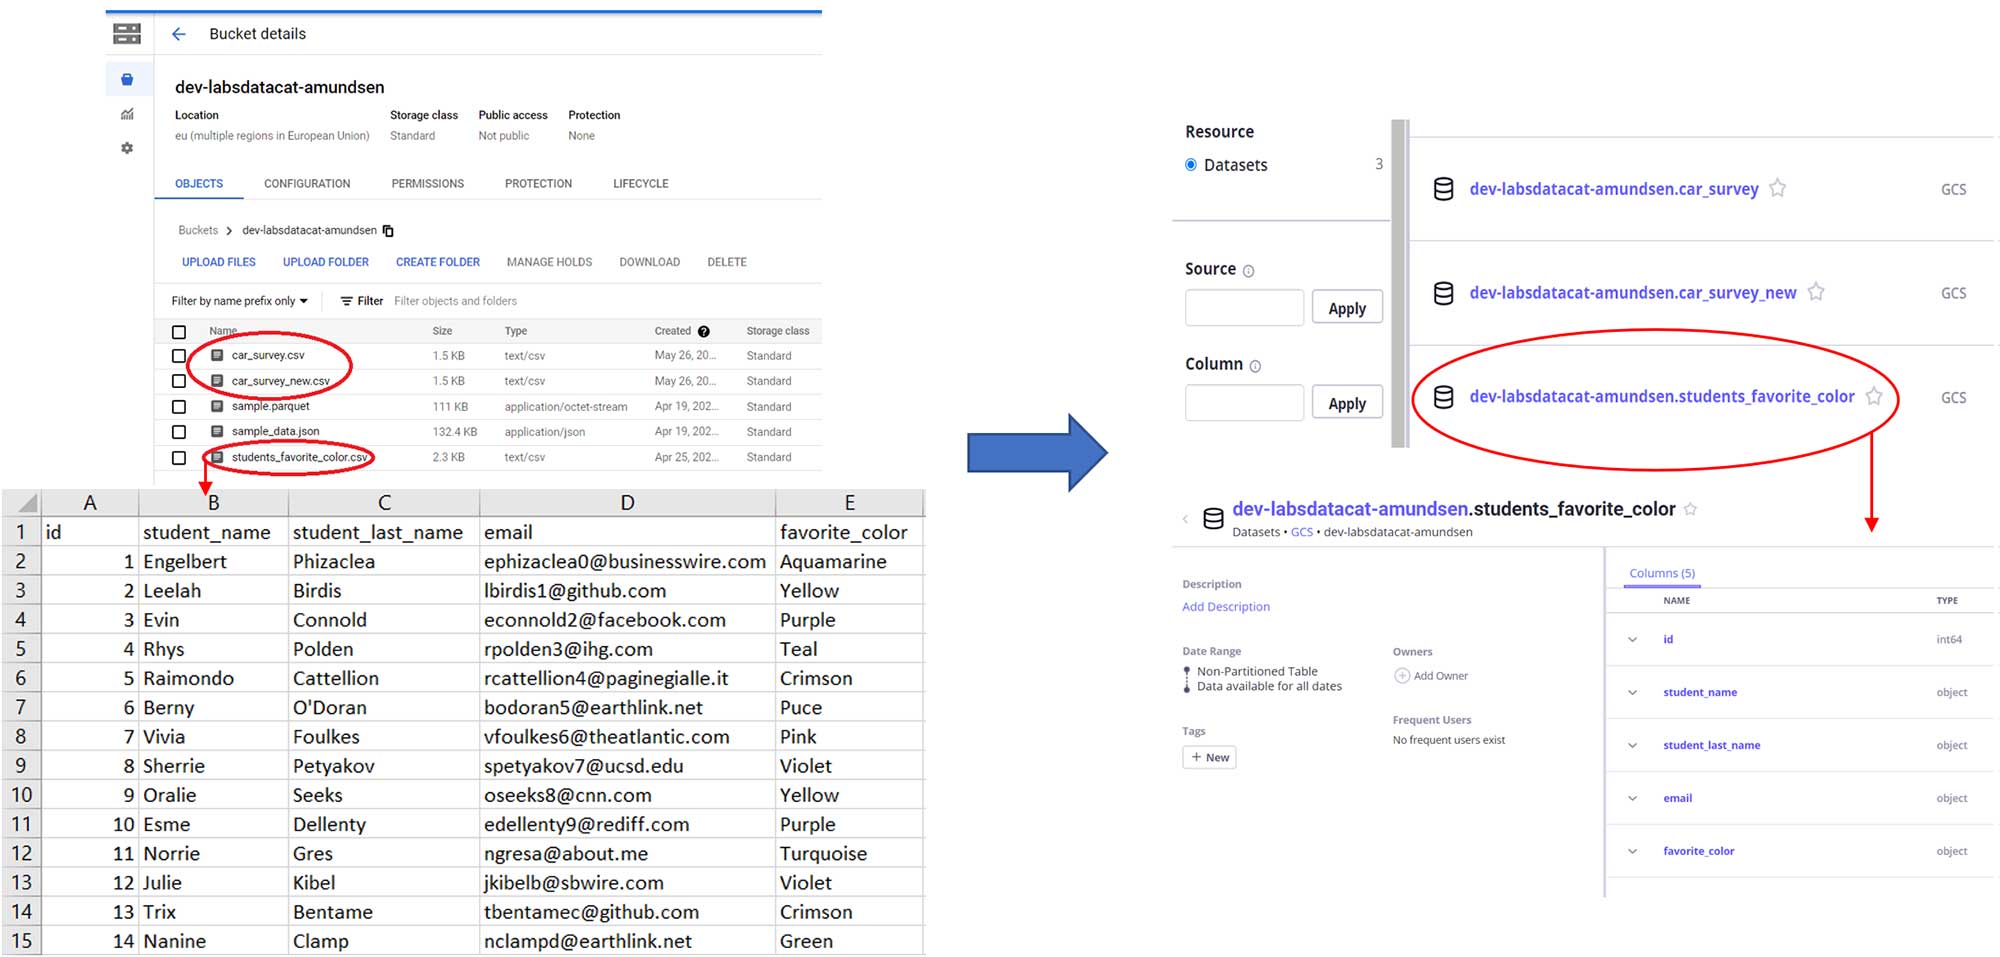
To give a better idea to the end user, as to how exactly this stored data looked before and after being put through Amundsen, Figures 3 and 4 at the end of this section display how that process looks at the beginning and at the end in the case of BigQuery and GCS. These were also the most important connectors in our case, since they are the most popularly used out of all the ones that were tested.
Figure 3: BigQuery (from source to Amundsen)
Figure 4: GCS (from source to Amundsen)
Business Glossary
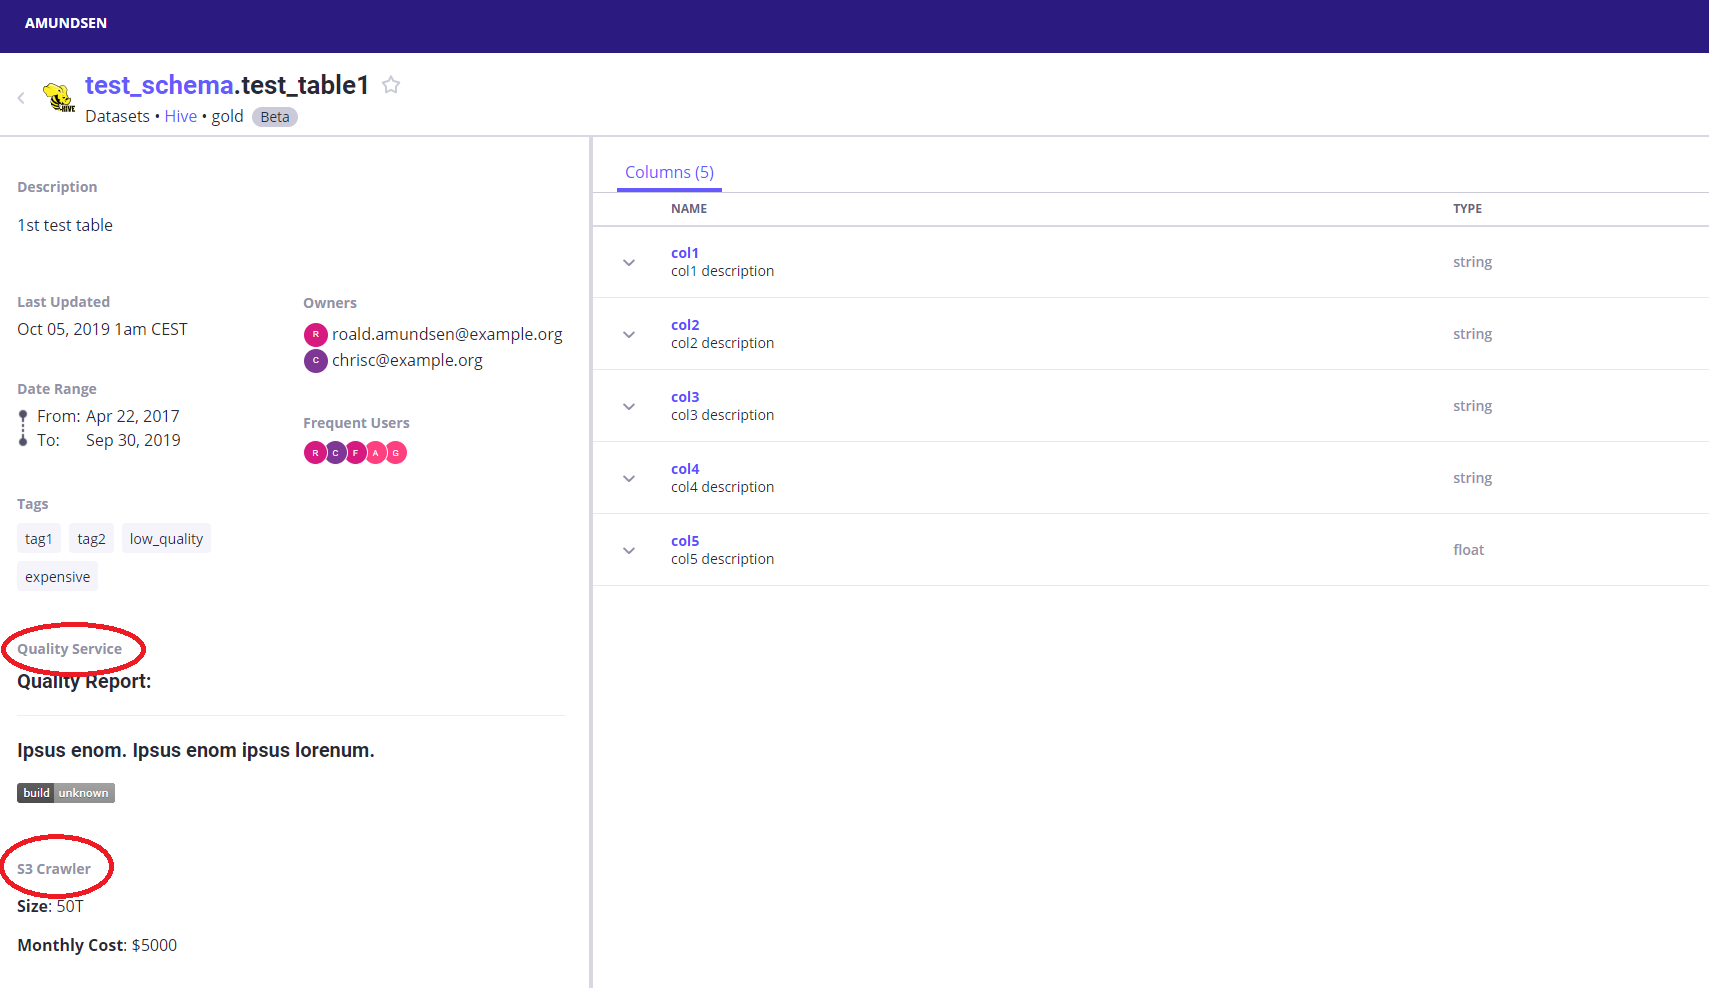
With regards to Business Glossary, Amundsen does not have a dedicated section for it, and real traces of Business Glossary being implemented in the code are nowhere to be found. Considering that the team who works on Amundsen does not declare Amundsen as a complete Data Catalog solution, it is to be expected that some lapses in the more business-oriented features do exist. The best option they provide, for something which could be considered a Business Glossary, is the fact that, apart from the Description section that every read dataset provides, they give you the ability to add your own Custom Description sections, examples of which can be seen in Figure 5 below:
Figure 5: Custom Description sections of sample data
These might not seem as much in the beginning, but these sections written in Markdown text provide a lot of features that are essential and can be seen in most standard Business Glossaries. The next step in this investigation was testing out all the capabilities of this so-called Business Glossary.
Considering that Business Glossary usually comes as a stand-alone page (i.e., articles in Alation Data Catalog) or as a dedicated section of the Data Catalog, we wanted to test out both scenarios and see what the potential limitations are.
Stand-alone Page
Currently, a stand-alone page is not viable for Business Glossary considering that it would require additional setup on the Frontend service of the application to work properly, which we did not really go into during this entire Amundsen investigation.
The best option currently is to drop a link in the previously mentioned Custom Description sections but this would only lead the user to a completely new website where the Business Glossary could then potentially be hosted. This might not be the best idea considering that we would like to keep users of the Data Catalog on the Catalog without them having to leave the Data Catalog for information, even though some companies have their Data Catalog & Business Glossary set up that way.
Dedicated Section of the Data Catalog (Custom Descriptions)
As previously mentioned, currently the only option that Amundsen provides for Business Glossary are the so-called Custom Descriptions. These sections get written and read in Markdown, which means that apart from just text they provide the ability to add some additional behavior to the text itself. Several of these behavioral changes, and section capabilities in general, were tested, and the results are as follows:
- A single section does not appear to have any limitations on how much text can be written in it. After pasting the whole “Lorem ipsum” text several times, the section just seemed to expand. When the text gets too big to be viewed all at once, a scroll bar gets added.
- The text written within cannot be overwritten by something else because it clearly states in the code that the information is pulled from the dataset source, it just gets positioned in the particular section instead of going to the regular Description visible at the top of the website.
- Since the text is Markdown, links are also enabled, both relative and absolute paths. They can link to any website but also to anything within the Amundsen Frontend Service
- Amundsen has internal tags implemented, which means that certain data can be tagged and searched using those tags through the Search Service. These tags can also be linked in the Business Glossary, which means that when they are clicked, they redirect you to the results of the search for files with the following tag.
- Adding some additional code here that could check for e.g., maximum-minimum value in a dataset, the average value, the most used blocks, how much information is stored in the dataset, etc., which would basically enable the Data Profiling part of the Data Catalog, is currently not enabled since technically you would have to enable code blocks to be run in Markdown. There are some extensions out there that could potentially enable that for you but for the purposes of our investigation, they were not tested. Luckily there are some out-of-the-box Data Profiling options which we will cover below.
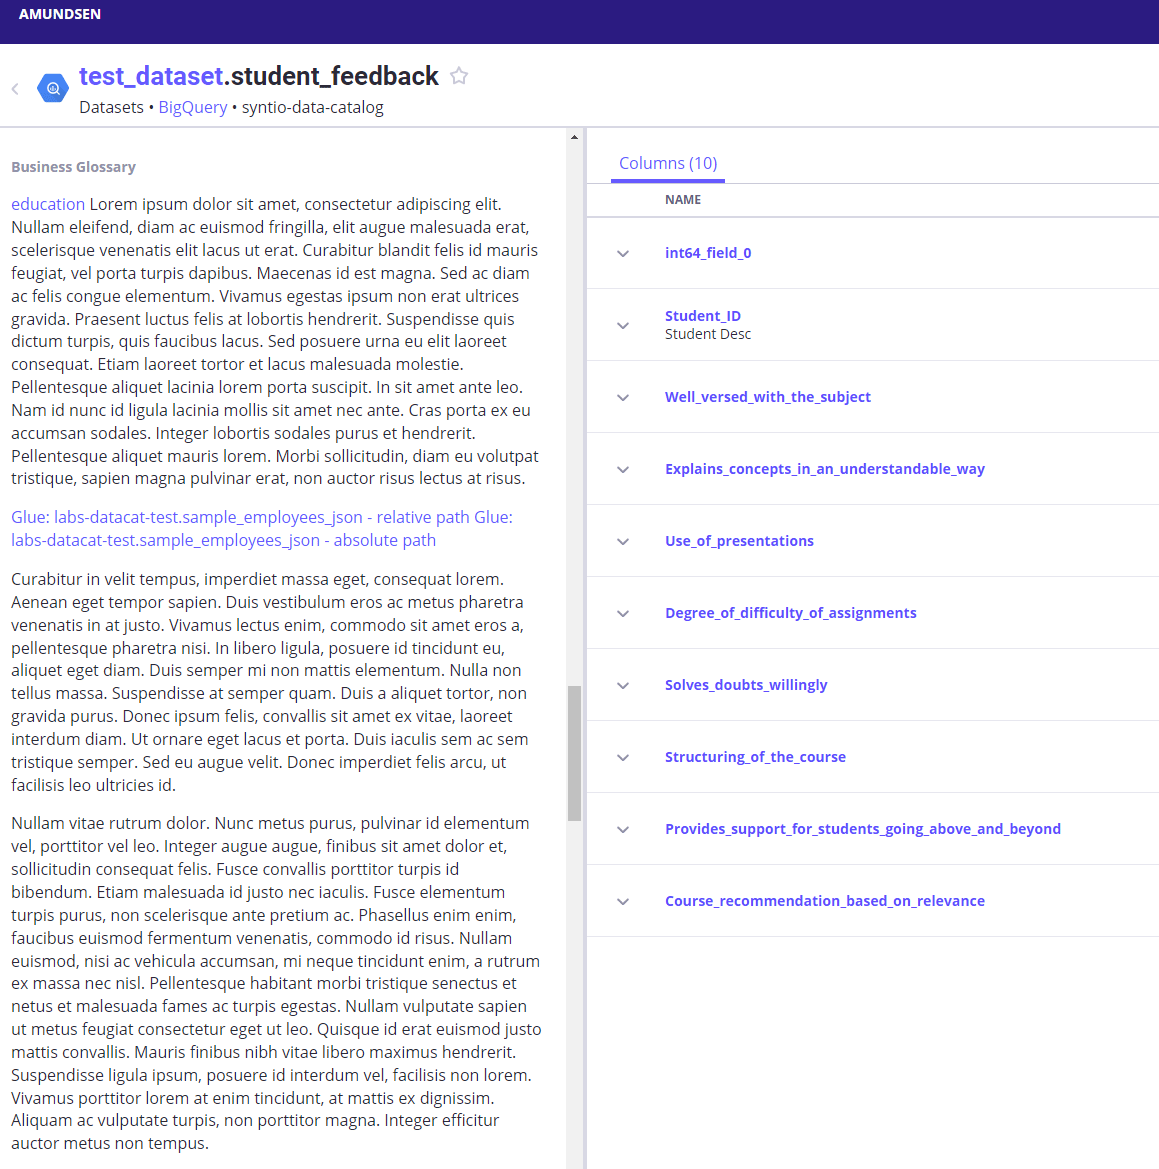
An example for almost all of the previously mentioned behaviors can be found in Figure 6 below:
Figure 6: Tested Behaviors of the Custom Description section
Apart from these tested behaviors, the biggest downside to enabling most of these to work is the fact that the person writing the description in a data source would have to write proper Markdown text, which might not be easy to do, especially for a Business User who is writing a description of their dataset.
Data Profiling
In Amundsen, Data Profiling is enabled through the use of a well-known Python library called Pandas. The main reason for using Pandas for the purposes of Data Profiling, is its exceptional API for creating profiling reports on previously read file types.
Brief Overview of Pandas
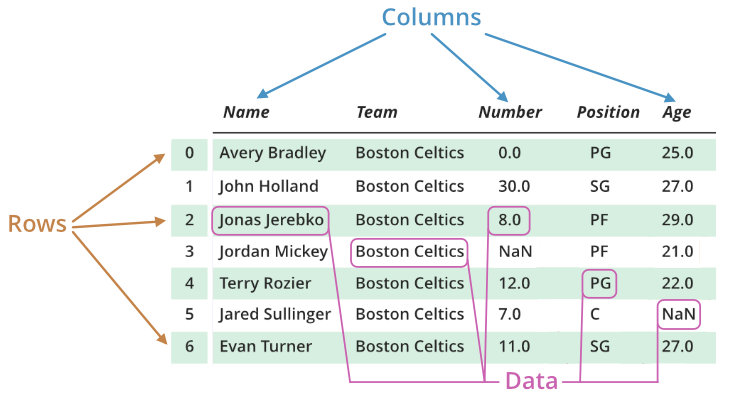
Any file type read by Pandas gets saved into an object called DataFrame. These DataFrames are two-dimensional, size-mutable, potentially heterogeneous, tabular data structures with labeled axes (rows and columns). An example of what a DataFrame looks like can be seen in Figure 7 below:
Figure 7: Pandas DataFrame
Brief Overview of Pandas Profiling
The profiling report of the file can be created by leveraging the Pandas module pandas-profiling. This module can perform exploratory data analysis, just by providing it with the previously read file, and writing a few lines of code.
This analysis provides us with the report file, which is then used to provide Amundsen with information on the so-called column stats of a dataset.
You might be wondering “Why the long explanation of Pandas at the beginning of this section?“. Well, the main reason for that is that even though Amundsen comes with an out-of-the-box enabler for Data Profiling, the users have to generate the reports themselves through Pandas, and then provide those created reports to the scripts dedicated to Pandas profiling.
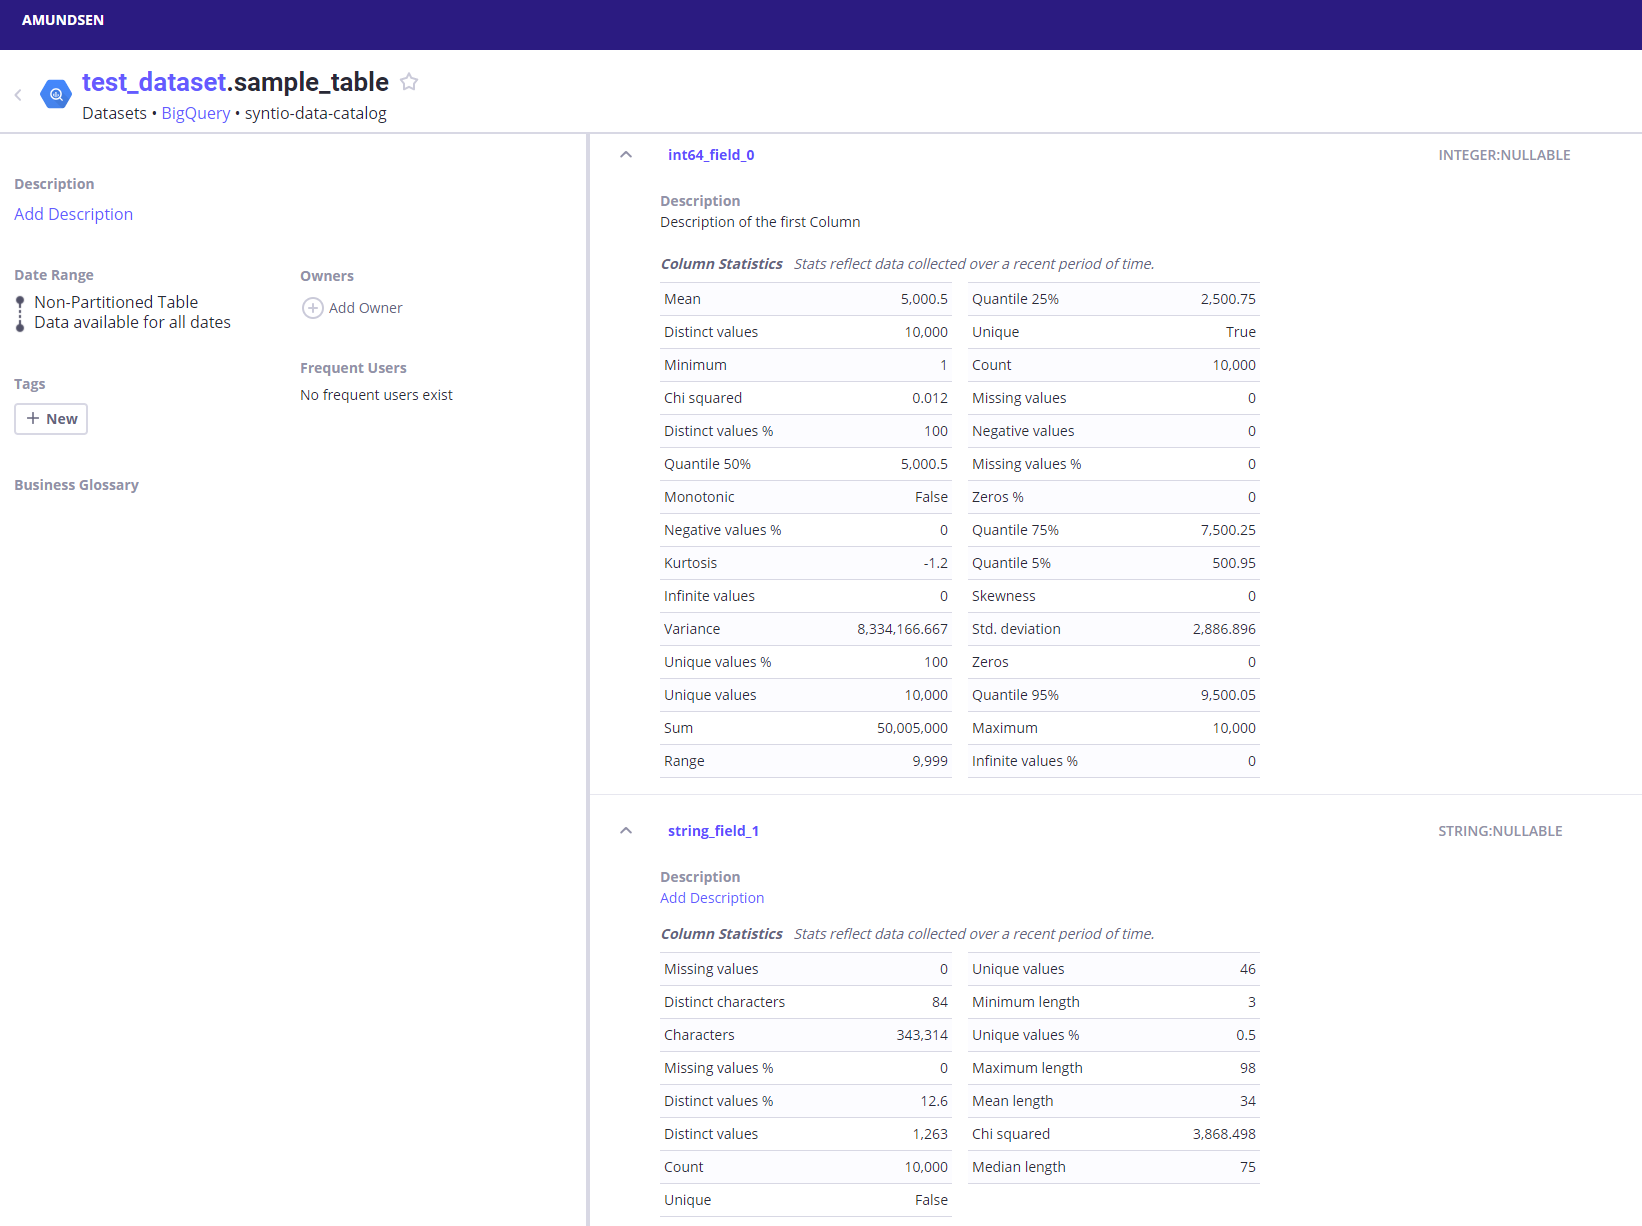
An example of how this data looks once it gets plugged into Amundsen can be seen in Figure 8 below:
Figure 8: Data Profiling in Amundsen
Profiling Options
Based on the data type of the table column, Pandas Profiling splits columns into Numeric ones for numerical values like Integer, and Float, and Categorical ones for String-like objects. Each of these holds a different set of parameters.
As of yet, the Numeric columns will by default calculate the following 30 parameters:
- Quantile (5, 25, 50, 75, and 95%)
- Chi-Squared
- Count
- Unique
- Kurtosis
- Maximum – Minimum
- Mean
- Monotonic
- Distinct, Infinite, Missing, Negative, and Unique values
- Distinct, Infinite, Missing, Negative, and Unique values percentage %
- Zeros
- Zeros percentage %
- Range
- Skewness
- Std. deviation (read: Standard deviation)
- Sum
- Variance
The Categorical columns will by default calculate the following 15 parameters:
- Chi-Squared
- Count
- Unique
- Maximum, Minimum, Mean, and Median length
- Characters
- Distinct characters
- Distinct, Missing, and Unique values
- Distinct, Missing, and Unique values percentage %
All of these provide the user with general knowledge about the data, while also providing specific statistical measures which can later be used for further, more in-depth analysis.
Apart from the observed behavior, potentially the biggest downside of the current way of performing Data Profiling in Amundsen is the need for creating a report which then gets plugged into the preexisting scripts. This makes enabling the Data Profiling a slightly tedious task. The whole process would work much more seamlessly if an additional layer, where reports get created automatically just by adding a new dataset, was enabled.
Access Management
In Amundsen, IAM is not enabled by default, but it is implemented. This means that upon the initial use, let’s say for loading and viewing the sample data, Amundsen will not have User Profiles, and the rest of Access Management enabled. Nonetheless, Amundsen DOES have that part implemented in code but in order to enable it, various instructions have to be followed, some of which can be found on the links below:
https://www.stemma.ai/blog-post/how-to-setup-oidc-authentication-in-amundsen,
https://www.amundsen.io/amundsen/tutorials/user-profiles/,
https://atlan.com/amundsen-oidc-setup/,
https://nirav-langaliya.medium.com/setup-oidc-authentication-with-lyft-amundsen-via-okta-eb0b89d724d3
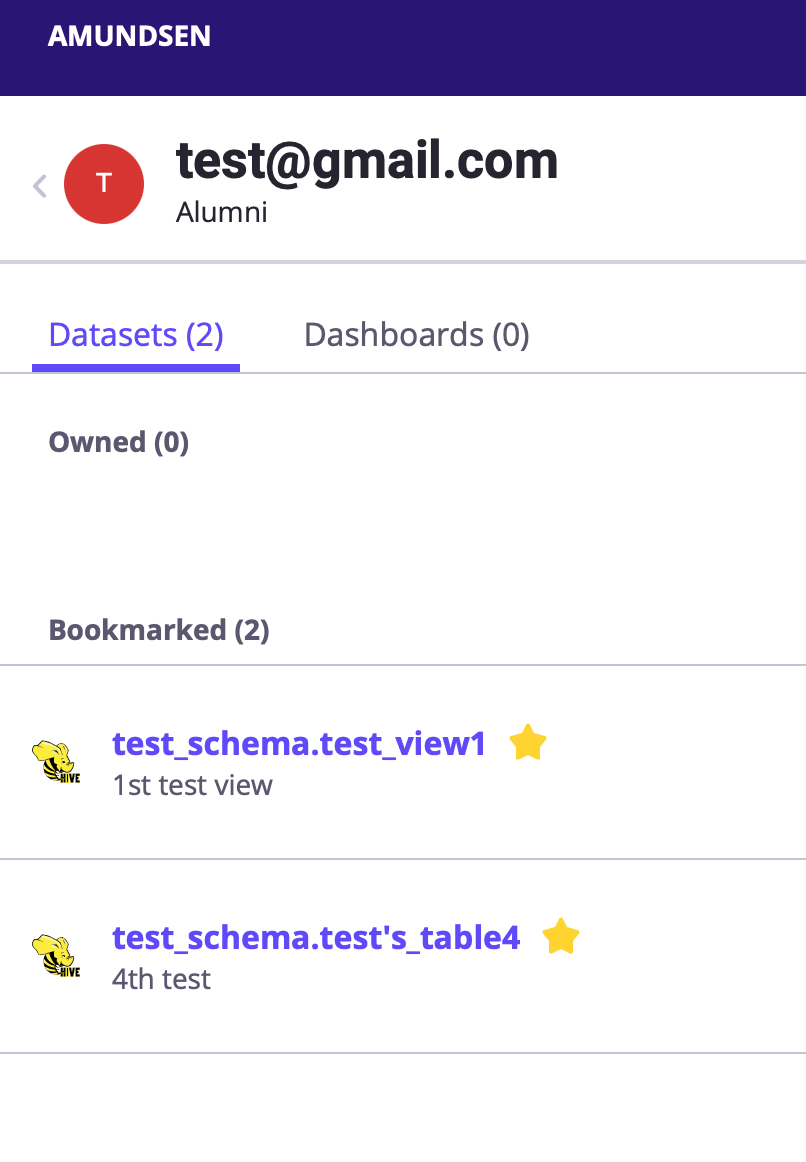
The end result should look something like the images below:
Figure 9: Access Management in Amundsen
In order to enable Access Management all of the four previously mentioned links were followed, particularly the initial one mentioned: https://www.stemma.ai/blog-post/how-to-setup-oidc-authentication-in-amundsen. This was due to the fact that they all basically have fairly similar instructions, the one mentioned being from the creator of Access Management in Amundsen himself.
Unfortunately, after following the instructions for most of the process we ran into some adversity. The problem we ran into was the fact that in order to enable Users in the Amundsen services, some minor changes needed to be made to some of the files of the Frontend service. In order to enable those changes to be present after starting Amundsen, those changes needed to be built into a new Docker image with the following command:
docker build -t <tag-of-your-new-Docker-image> -f Dockerfile.frontend.public .
This newly created Docker image could then be used in the previously mentioned docker-amundsen.yml file.
This sounds great, until one realizes that the Docker file used for building a new Docker image for the Frontend service, which can be found here https://github.com/amundsen-io/amundsen/blob/main/Dockerfile.frontend.public, has some issues with regards to npm (the Node Package Manager) when trying to build it, one of which being:
sh: 1: cross-env: Permission denied
npm ERR! code ELIFECYCLE
npm ERR! errno 126
npm ERR! static@1.0.0 build: `cross-env TS_NODE_PROJECT='tsconfig.webpack.json' webpack --progress --config webpack.prod.ts`
npm ERR! Exit status 126
npm ERR!
npm ERR! Failed at the static@1.0.0 build script.
npm ERR! This is probably not a problem with npm. There is likely additional logging output above.


npm ERR! A complete log of this run can be found in:
npm ERR! /root/.npm/_logs/2022-06-07T11_07_05_325Z-debug.log
Several different methods were tried when trying to fix this error but none of them worked, so we decided to close this chapter of Access Management in Amundsen for now.
Summary
After extensively researching Amundsen as a potential Data Catalog option that could be further built upon, we compiled a list of pros and cons, as to why or why not to use it:
PROS:
- Holds a big list of approximately 20 fully created connectors. The potential issue here is that since we did not have the chance to test all of them, there is a big possibility that some of them might be outdated, since rules-of-usage for different software change over time.
- A very active Slack channel, where a lot of the current users that are currently implementing Amundsen in their business can seek help with regards to whatever their issue is, from developers that are working or have previously worked on the development of the tool itself.
- There is also a monthly community meeting about the latest releases, where more often than not, a different company talks about how they implemented Amundsen in their own business.
- Its biggest highlight is the fact that it is open-source. It was open-sourced by the company Lyft, some time ago, and it plans to stay that way for the long run.
CONS:
- The biggest issue would potentially be the lack of documentation which can sometimes leave a lot to be desired without much explanation. This can cause issues with tools and software that the person has not previously worked with.
- During setup and installation, we also faced some adversity with the versioning of different packages and libraries used. This initially led to several issues but due to some recent updates to the Github repo by the Amundsen team of developers, those problems seem to have been resolved for now.
- Some of the out-of-the-box solutions might not work as expected or at least as hoped.
- In order to ingest some dummy data, the setup requires some development experience because the whole ordeal might be a little too much for a regular Business user who just wants to use the data within the Data Catalog.
*All the code newly implemented for the purposes of running different Amundsen connectors and features can be found on the following link: https://github.com/syntio/DEV-labsdatacat-amundsen.
In our next Blog, you can read more about the final Data Catalog, and our personal favorite – OpenMetadata.
Next blog post fom Data Catalog series:
Testing Open Source Data Catalogs – part 2

