Tea Bratic, Filip Milic
DATA ENGINEERS
Description of a data pipeline with simple lookup logic implemented in Google Cloud Platform.
This blog post will provide a description of a data pipeline with simple lookup logic implemented in Google Cloud Platform. Lookups are usually used for data enrichment and data mappings. It’s a common component in data transformations used for simple integration logic when records from multiple source systems need to get common value, as a master data value.
Task Overview
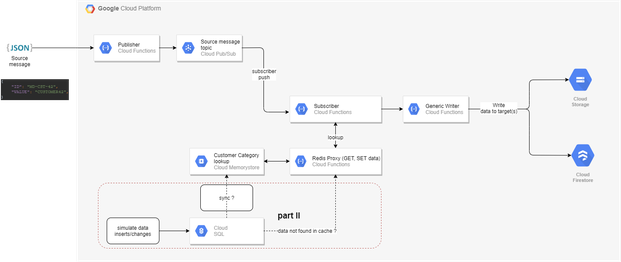
Cloud Pub/Sub is a fully-managed real-time messaging service that allows you to send and receive messages between independent applications. A publisher application creates and sends messages to a topic. Subscriber creates a subscription to a topic to receive messages from it. When the subscriber processes the message, it will try to find values on Redis. The subscriber will fetch them and make sure they are valid, and push those values to a Generic writer. Generic writer is a Cloud Function set to an HTTP trigger, which serves to store data in Cloud Firestore and Cloud Storage.
Procedure
Whole process will be done on Google Cloud Platform. The only prerequisite is a Google Cloud Platform account. The source code is written in Python 3.
The task can be divided into the following steps:
- Creating a Memorystore instance
- Creating a Serverless VPC connector
- Connecting to a Redis instance
- Creating the subscriber
- Creating the publisher
Performance tests and the analysis of time needed for processing messages will we presented at the end of this post.
Creating a Memorystore Instance
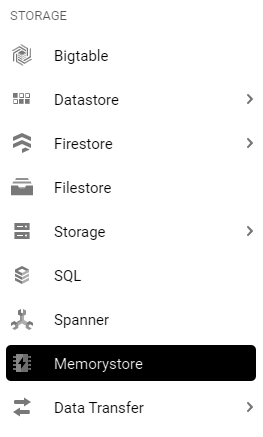
Firstly, Google Cloud Memorystore for Redis API must be enabled. Then, in Google Navigation menu, open Storage > Memorystore.
Choose to Create an instance.
Set the Instance ID and Display name. For the purposes of this exercise, the Basic Tier will do just fine. Keep the capacity at 1 GB (the minimum).
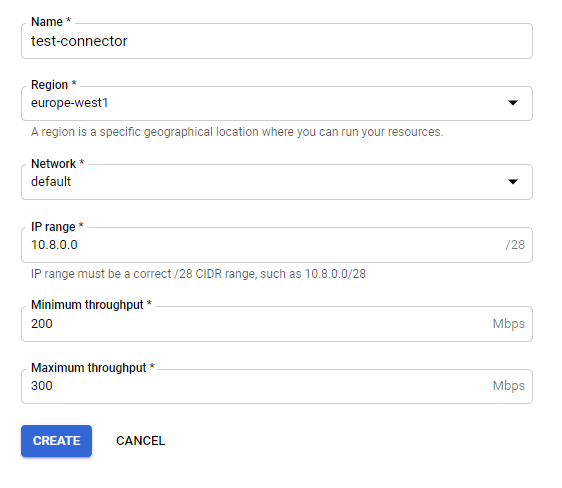
Take note of two things here: the Region and the Authorized network you set the instance to. In our case, we will be using the europe-west1region and the default network.
The region must be the same as the one used for the Memorystore and cloud functions! For everything else, default setting are used.
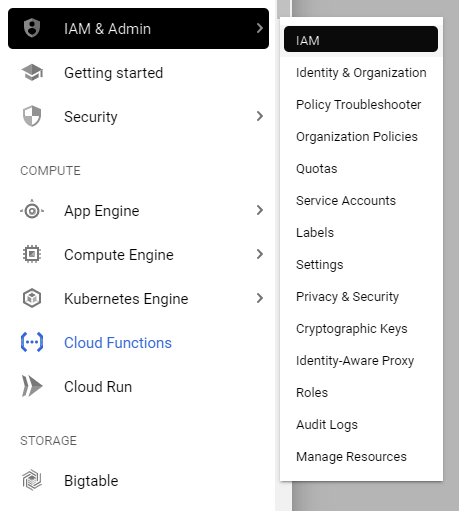
One thing to take into consideration for this entire scheme to work is to make sure the cloud function service agent can access this VPC connector. To do so, in the navigation bar, select IAM & Admin > IAM:
In the list of accounts, the Cloud Function Service Agent must have the following permissions:
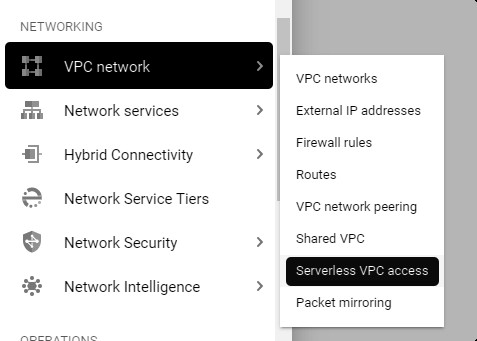
The Cloud Function will serve as a proxy to our Redis instance. When creating the function, the previously created VPC connector under Egress settings has to be selected:
By using Serverless VPC Access, a connection can be established to a Redis instance from Cloud Functions. The function is triggered with an HTTP call. In order to read from memory, the request GET is used and the KEY is set in the URL parameter.
# Getting data from redis def get_data(redis_c, args): try: req
= redis_c.get(args['Key']) if not req: #The DBLook parameter is used in
case when value does not exist in Redis. If we want to find values in
SQL database, DBLook will be set to True. if 'DBLook' in args and
args['DBLook'] == 'True': return get_database_data(redis_c, args) return
json.dumps({'Data': ''}) else: return json.dumps({'Data':
req.decode("utf-8"), 'Find': 'INSTANT'}) except redis.TimeoutError:
logging.error(RuntimeError("TIMEOUT ERROR!")) return "Error"
By using POST, data packaged in a JSON file is stored with a ‘Key’: Value and a ‘Data’: String.
# Storing data into Redis def put_data(redis_c, args): try:
redis_c.set(args['Key'], args['Data'], ex=REDIS_SET_DATA_TIMEOUT) return
json.dumps(args) except redis.TimeoutError:
logging.error(RuntimeError("TIMEOUT ERROR!")) return "Error"
The component needs to be properly (manually) configured for a specific Redis instance:
REDIS_IP = ‘[REDIS_IP]’ REDIS_PORT_NUM = [PORT NUMBER]
REDIS_SET_TIMEOUT = 10 REDIS_SET_DATA_TIMEOUT = 5000
REDIS_MAX_CONNECTIONS = 2000 redis_c = redis.StrictRedis(host=REDIS_IP,
port=REDIS_PORT_NUM, socket_timeout=REDIS_SET_TIMEOUT,
socket_connect_timeout=REDIS_SET_TIMEOUT,
max_connections=REDIS_MAX_CONNECTIONS)
The interesting thing about this approach is, depending on the settings for the Cloud Function that connects to Redis, the limitation of Redis being only accessible from the same network has effectively been avoided since this cloud function is working as a proxy!
Redis/SQL Synchronization Job
As mentioned before, a simple cloud function set to run periodically (ex. one hour) using the Google Cloud Scheduler, is used for synchronization. In this case, contents of an entire table will be transferred into Redis, consisting of (ID, VALUE, CATEGORY) rows. The ID will place the (VALUE, CATEGORY) part of the rows into a JSON file, and store it in Redis, using the ID as key.
Creating the subscriber
The subscriber is a cloud function set to a Pub/Sub trigger to our topic. When the subscriber receives a message from the topic, it sends a request to check for VALUE and gets CATEGORY using ID in Redis lookup table.
# Get the ID used for lookup ID_lookup = data["ID"] # Arguments
for connecting to the cloud function that has our Redis component
redis_args = { "Key" : ID_lookup, "DBLook": "True" } # Connecting to
REDIS and error handling. try: r = session.get(url =
'REDIS_CLOUD_FUNCTION_URL', params=redis_args, timeout=timeout) if not r
or r.text == "Error": logging.error(RuntimeError("ERROR WITH REDIS
COMPONENT!")) r = {'Data' : ''} else: r = r.json() except Exception as
e: logging.error(RuntimeError("PROBLEM WITH CONNECTING TO REDIS
COMPONENT! " + str(e.__class__.__name__))) r = {'Data': ''} attempt =
r['Data'] data_valid = False validity = 'Invalid_Customers' category =
'-99' if attempt != '': # If 'Data' did not come back as an empty
string, that means something was cached red_data = json.loads(attempt) #
Check the validity of the things in the lookup if data["VALUE"] ==
red_data["VALUE"] and data["VALUE"] != "" and "CATEGORY" in red_data:
data_valid = True validity = 'Valid_Customers' category =
red_data["CATEGORY"] else: # The value is clearly NOT cached in Redis
print("Didn't find a JSON file on REDIS for requested ID!") # Add the
category to the data (either -99 if nothing was found or the correct
data) data["CATEGORY"] = category # Add a random ID if the value was
incorrect if not data_valid: data["ID"] = random_ID(10) print("Unable to
find the proper value match, writing in new ID and category!", data)
The subscriber sends a request to check for VALUE and gets CATEGORY using ID in the Redis lookup table. If these values exist in Redis (and if the value retrieved from Redis matches the one received in the message), it adds a category that it reads from Redis. Otherwise, the subscriber reforms the message data by adding a new ID with CATEGORY value of -99. Either way, in the end, it sends a POST request to the generic writer to save everything.
Creating the publisher
The publisher is a cloud function or a locally written program, which sends messages to the topic. As a cloud function, it is set to HTTP trigger. The main limitation of a cloud function is the timeout duration, a maximum of 9 minutes. If the Cloud Function has not completed by the timeout duration, then the Function will be terminated. Because of this limitation, using a cloud function publisher is not an option if messages are being published for a longer period of time. In those cases, using a locally created program is preferred.
Performance testing
TEST 1
For initial test, the publisher is publishing messages at a rate of 200 messages/second for 20 minutes. This test will be done by continuously publishing the same 10,000 messages with a local publisher. The results are analyzed by using the Metrics Explorer that tracks the metric set to the subscriber function execution time.
All the messages are valid and present in Redis.
The core results showed no timeouts, crashes or errors on any of the components. In addition, no message was stored as invalid.
We observed that for all our components, the number of invocations per second was at a steady 200 invocations/second, which matches with the publisher’s speed.
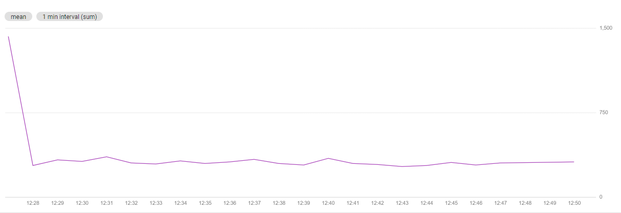
As for the test itself, looking at a graph of the average execution time per minute (graph below), we can see that it generally seems to fall in the 300-400 millisecond range:
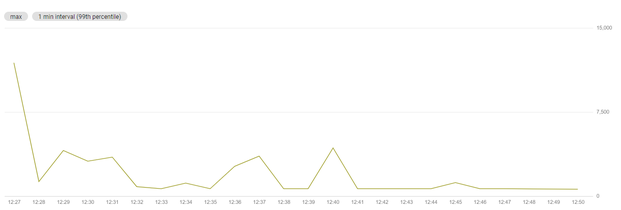
We noticed that the largest high is near the beginning (cold start), with fluctuations throughout the processing being generally minor, to the point where they do not seem to affect the average too much, as seen on the graph below:
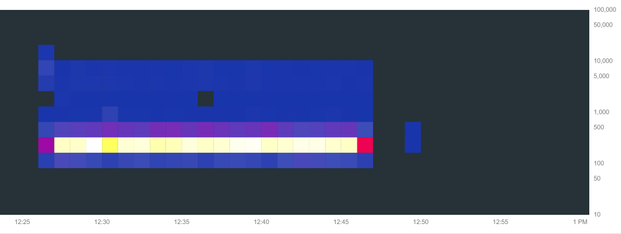
A look at our heatmap:
We observed the following distributions of time intervals and execution percentages:
|
Execution time [ms] |
Number of executions |
Percentage |
|
81.92 – 163.84 |
17,404 |
7% |
|
163.84 – 327.68 |
179,311 |
74% |
|
327.68 – 655.36 |
39689 |
16% |
|
655.36 – 1,310.7 |
980 |
<1% |
|
1,310.7 – 2,621,4 |
129 |
1% |
|
2,621.4 – 5,242,9 |
1,445 |
1% |
|
5,242.9 – 10,486 |
1,475 |
1% |
|
10,486 – 20,972 |
62 |
<1% |
It should be noted that the numbers acquired using the metrics explorer should be taken with a grain of salt. For example, the total number of executions should equal to the number of messages (240,000), the sum of the number of executions in the heatmap seems to go over 240,000. On the other hand, when checking the Cloud Function → Executions metric, the number of executions seems to go below 240,000. Another example of this is also in the Cloud Function → Executions metric: it seems to imply that our Redis and Writer instances have more executions for our given timeframe than the number of executions the subscriber has. This is impossible, because the only way for those numbers to not be equal is if the Redis or Writer cloud function crashed or timed out, forcing the subscriber instance to retry.
This is possibly due to the way the metrics explorer aligns its data on the graph, causing inconsistencies in the numbers.
While looking over the results, we would like to discuss a potential oversight in using Cloud Functions that communicate with each other using HTTP calls. Namely – the way it affects costs.
For example, if a subscriber instance sends out an HTTP call to the Writer instance, it must block its execution and wait for the Writer component response. If the writer component takes 250 milliseconds to execute, that means that the subscriber function’s execution time will also be 250 milliseconds longer. And since GCP charges by execution time in milliseconds, we are effectively paying for 500 milliseconds as a result, even though the entire thing took 250 milliseconds and the Writer function was the one doing all the work.
TEST 2
Two publishers simultaneously publishing messages to the same topic, each at a rate of 200 messages/second for 20 minutes. The data to be looked up will be present in Redis. Each publisher will send 240,000 messages, meaning 480,000 messages in total.
-
The first publisher was started at 08:47:57.281. It ended at 09:08:19.748.
-
The second publisher was started at 08:48:05.067. It ended at 09:09:06.237.
(The slight gap in finishing times could be explained by the fact that the two publishers had been running on two different computers, with one of the computers potentially lagging at one point.)
Most of the messages were processed by 09:09:05.975 (the time of the last subscriber function finishing execution.) The exception is the 30 or so messages that were pushed to the subscriber cloud function a few minutes after this time. Data showed that the time difference between the publisher publishing the message and the subscriber receiving the message to process it was around 601 seconds. The reason for this phenomenon likely lies in the way GCP handles triggering Cloud Functions and sending messages. It is very possible it might scale over time; but the extent at which it might do so is currently unknown.
Furthermore:
-
No components raised errors during the test.
-
480,000 messages were stored as valid.
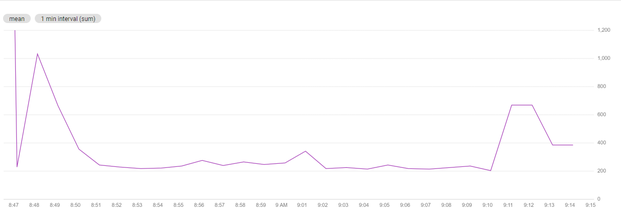
Looking at the graph of average function execution times per minute:
Spikes are observed in the beginning and near the end; neither raising too far beyond a second. Throughout most of the test, the execution time seemed to be stable, generally around the [200, 300] millisecond interval. The average execution time for the subscriber component is roughly 267.67 milliseconds.
With the distribution across certain intervals being as follows:
|
Execution time [ms] |
Number of executions |
Percentage |
|
81.92 – 163.84 |
119,432 |
25% |
|
163.84 – 327.68 |
301,205 |
63% |
|
327.68 – 655.36 |
53,047 |
11% |
|
655.36 – 1,310.7 |
2,759 |
<1% |
|
1.310.7 – 2,621.4 |
935 |
<1% |
|
2,621.4 – 5,242.9 |
1,874 |
<1% |
|
5,242.9 – 10,486 |
820 |
<1% |
|
10,486 – 20,972 |
49 |
<1% |
These numbers seem to match the results of our previous experiments.
TEST 3
Three publishers starting at the same time, each publisher publishing 140,000 messages to the same topic. Publishers will send 420,000 messages in total.
As before, all the messages are valid and present in Redis.
-
The first publisher was started at 09:53:23.842. It ended at 09:53:44.089.
-
The second publisher was started at 09:53:26.352. It ended at 09:53:39.727.
-
The third publisher was started at 09:53:25.415. It ended at 09:53:51.167.
The last subscriber instance ends at 10:05:22.829.Almost all instances ended at 09:58:18.407, while 32 instances started at 10:05:17.460and ended at 10:05:22.829.
For the first time, we have reached the quota limit for cloud function. The error that occurs with this test is: quota exceeded. The error is raised for the subscriber.
Error description that occurs: quota exceeded (Quota exceeded for quota group ‘CPUMilliSeconds-europe-west1’ and limit ‘CPU allocation in function invocations for europe-west1 per 100 seconds’ of service ‘cloudfunctions.googleapis.com‘ for consumer ‘project_number:**** ‘.);
The quota limit we have is GHz-seconds (The number of GHz-seconds consumed by all running functions). The error you can see is raised when we reach that quota during a 100s time frame.
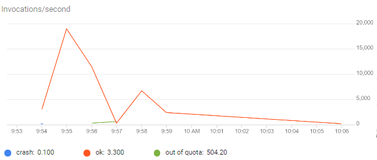
This is also the reason why some messages are lost or stored as invalid: 210,000 valid, 1,080 invalid and 208,920 lost messages.
The following graph shows the invocations for the subscriber:
As for the delay of the messages from the publishers to the subscriber, the following table shows the values obtained:
|
Delay time [s] |
Number of instances |
Percentage |
|
2.56 – 5.12 |
217 |
<1% |
|
5.12 – 10.24 |
298 |
<1% |
|
10.24-20.48 |
4945 |
1% |
|
20.48-40.96 |
50,932 |
12% |
|
40.96-81.92 |
159,415 |
38% |
|
81.92-163.84 |
119,171 |
28% |
|
163.84-327.69 |
89,924 |
21% |
|
655.36-1,310.7 |
33 |
<1% |
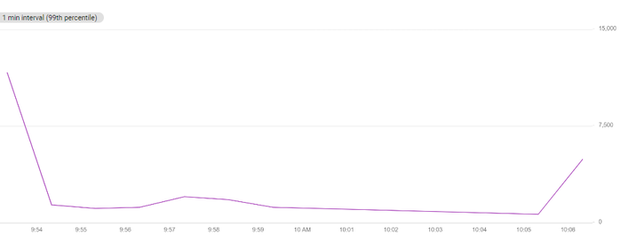
From the following graph we can see that over time, delays in receiving messages are increasing.
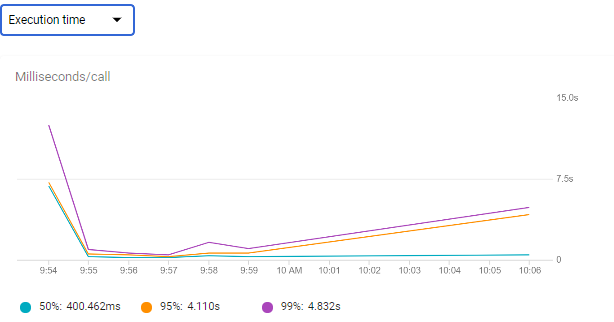
Looking at the graph of average function execution times (for the subscriber):
The average execution time for the subscriber component is roughly 371 milliseconds.
Looking at the heatmap supports this:
Please visit the second part of the blog series:

