Goran Dumic, Darija Strmecki
PRINCIPAL CONSULTANT, DATA ENGINEER
One of the most important steps when doing data integration is understanding the data we’re dealing with. What is the volume and the domain of the data, what are the typical range of values, and the nullability of columns. Anything that would impact the consumption stage at the very end of the data processing pipelines, like KPI calculation. Mostly, we tend to trust the documentation that was provided around that source and rely on some Business specifications of the new incoming data, doing some simple SQL queries to verify the assumptions. It gets even more challenging when doing the integration in the cloud, where cloud providers offer limited or no data profiling services. In this blog, we’ve decided to focus on creating a custom data quality and profiling solution from scratch, which in the further text will be referred to as DQ framework.
Quality across all transformation stages
Enterprises and enterprise-level projects and data platforms deal with vast volumes of data, but also a large number of data sources, APIs, Data lakes, and Data Warehouses. All have different access methods and protocols that are used to consume that data. In order to combine data from all these sources, we need a custom-built layer above all these layers that sees and is able to access, join and analyze all that data across all transformation stages.
Figure 1. Adding a quality layer on top of all existing data transformation layers
The Goal Use Case
The real-life use case we were trying to apply the quality check on is a classic AWS ingestion and transformation scenario, based on ingesting and transforming data across S3 (Raw/Staging, Data lake) and Redshift services. The DQ framework should be able to execute SQL-like queries on any of these, as well as apply basic statistics over the defined set of columns. This gives us the opportunity to do seamless data consistency tests, technical ETL and business rules testing, along with data quality checks.
What is useful to test? For instance:
- Does the Data source (Stage data) comply with certain requirements, e.g., uniqueness of a column, nullability, data type, specific patterns, etc.
- Does the implemented ETL comply with the requirements, e.g., the number of rows in the Data lake table is equal to the number of rows in the Redshift table and all of the business keys exist in Redshift (MINUS operator)
- Issues in ETL, e.g., detecting empty tables or columns that are always or mostly null, column value range such as indicators which are not within the expected range of values, etc.
- Potential errors in Business specification, e.g., columns being ingested in Data warehouse and not suitable for presentation layer (long texts or corrupted character values, ids instead of characters…)
AWS Services used in DQ framework
- AWS Glue job (contains all DQ Framework logic, including query execution and data profiling)
– with awswrangler import package used as a connector to Redshift - S3 (input config and output results)
Features
When designing the DQ framework, the driving thought was simplicity and easy collaboration. The desired outcome was that any developer could define new tests (simple JSON file) and add a new feature (DQ metrics in Pyspark Glue job). It needed to be integrated into CI/CD process, and decoupled from data transformation layers, for instance – we wouldn’t want a redshift procedure doing the work (it gets a bit messy adding new test cases in some central test cases table with bulky SQL long text strings and there’s no CI/CD integration).
Two basic types of tests needed to be supported:
- executing a query and counting something (count)
- executing a query and applying statistics on the columns (stats)
Furthermore, the framework needs to offer the flexibility of supporting a dynamic set of columns (queries), rather than static ones (fixed tables) which provides a wide range of supported complexity like lookups, joins, pre-filtering of the data, exclusion of certain columns, etc. Speaking of dynamics, tests need to be written with IaaC in mind, all having a set of data transformation stage variables that makes the tests deployable on all stages (development, qa, production). Within the test configuration file, tests can be logically split by test groups, e.g., dimensions, facts, lake. Tests for different source systems are separated into different files, so development teams working on a specific source can create and maintain tests independently.
Finally, the result of all tests is written on S3, in a dedicated Glue database. Consumed as a table, the results can be used in any presentation layer as a data quality dashboard.
Figure 2. The architecture of the solution
Desired outcome
The outcome of the framework should be:
- executed all queries defined in the test configuration, for a given source system
- output is written in a table (on S3containing data about test results
- for the “count” test type, the output will be 1 row, one per given query
- for the “stats” test type, the output will be
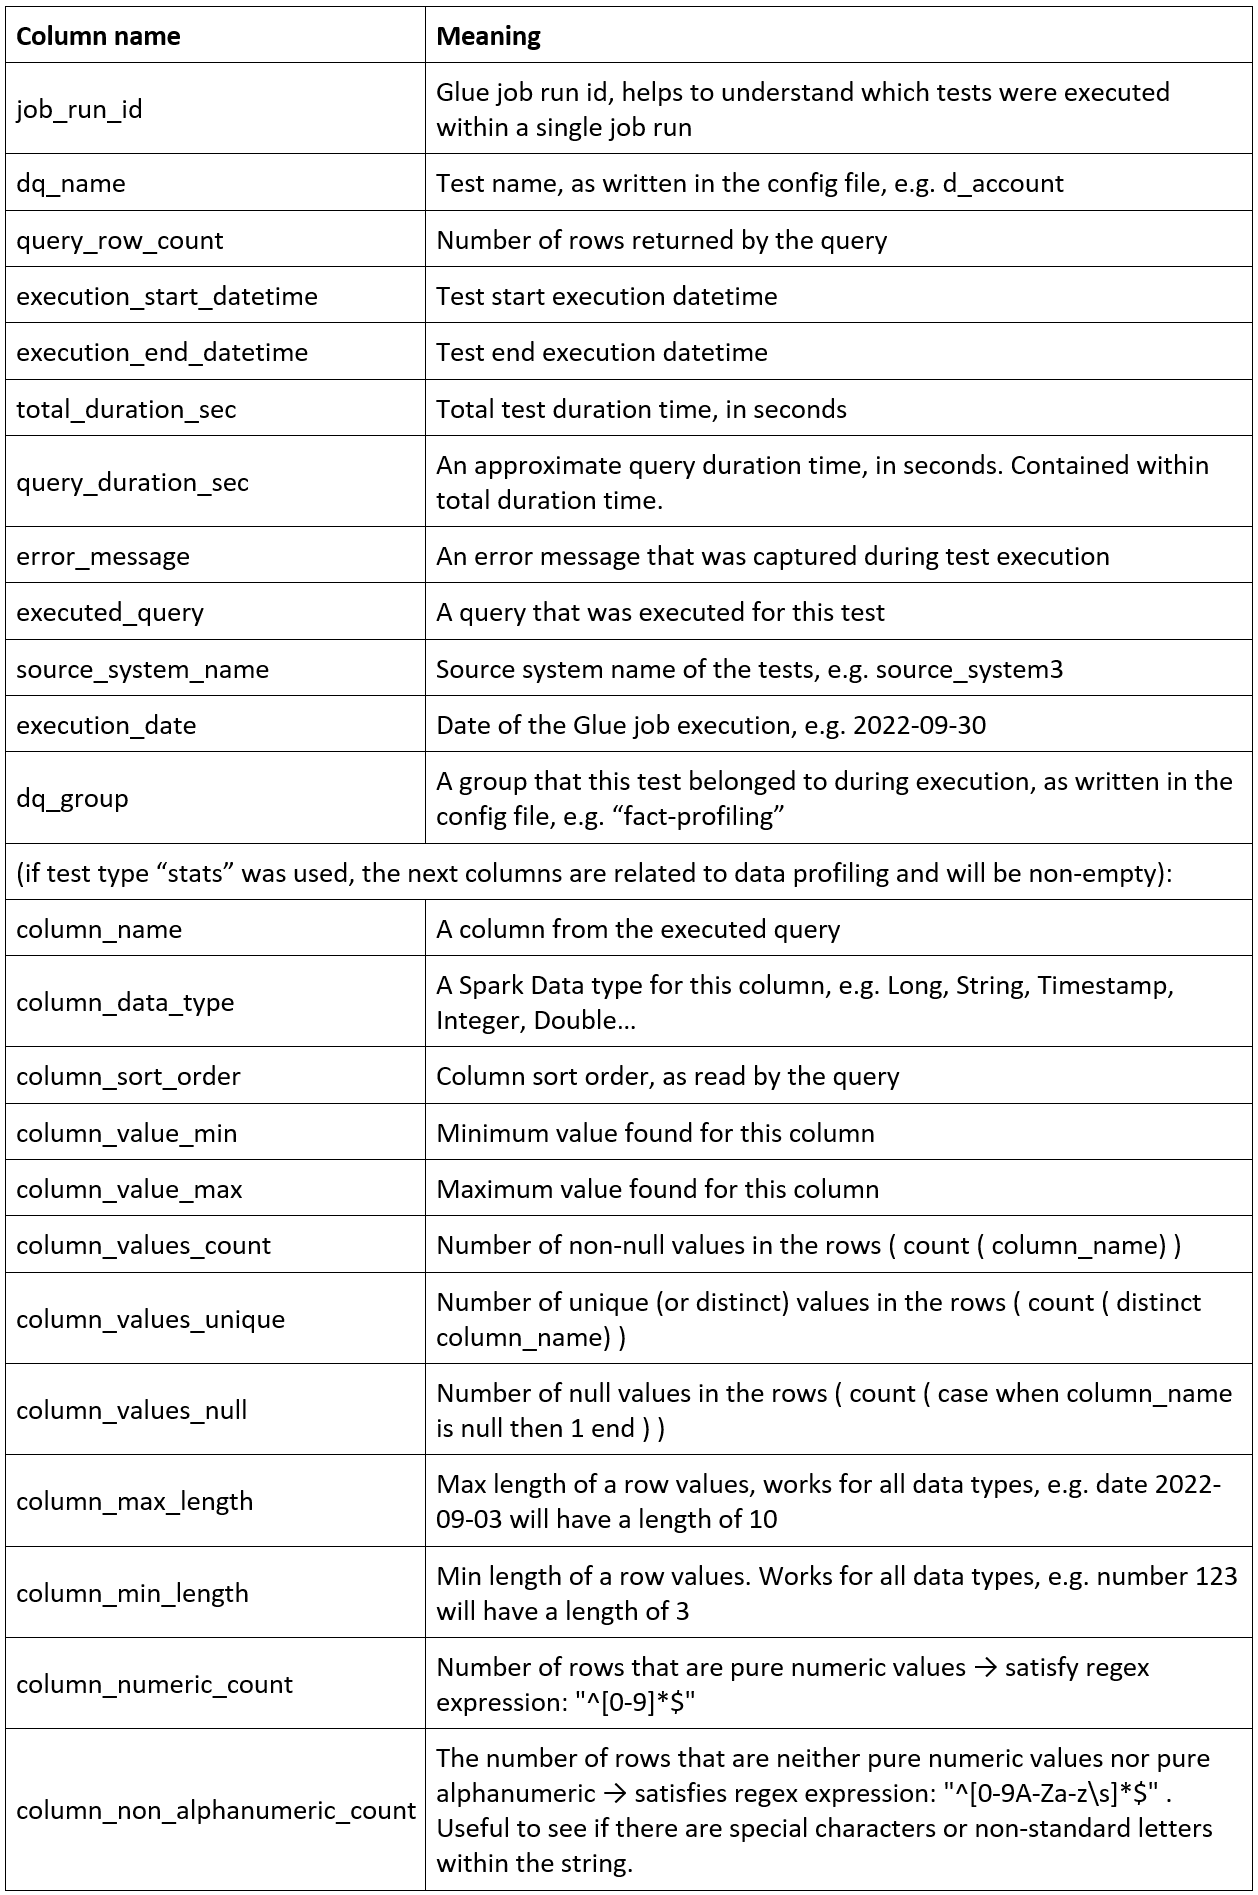
Figure 3. DQ Framework output part I. Common to both “count” and “stats” test types.
Figure 4. DQ Framework output part II. Specific to “stats” test only.
Figure 5. DQ Framework output part III. Specific to “stats” test only.
Configuration
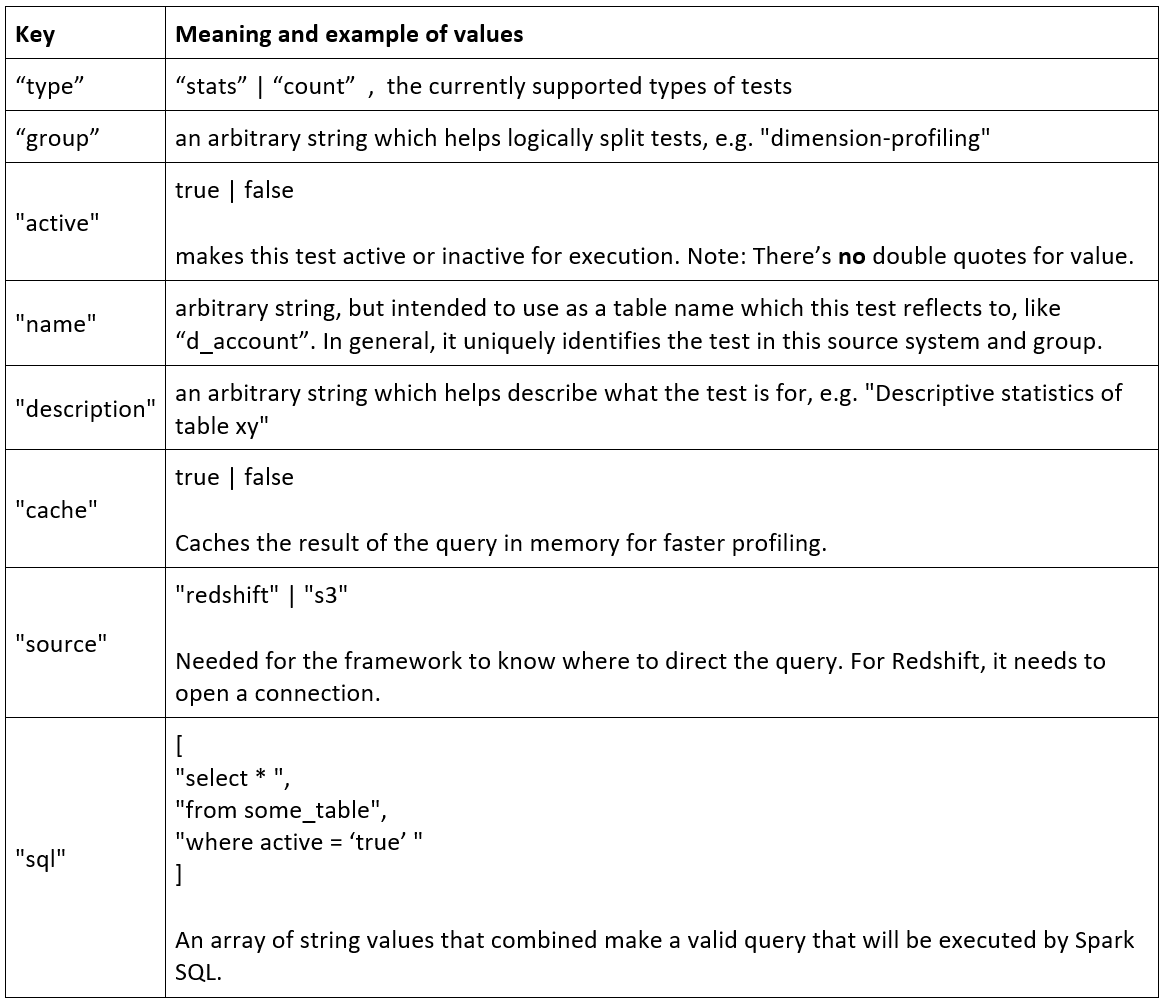
The heart of DQ Framework is the configuration of tests. It is a simple json file that contains these keys:
Here are few examples for stats and count type of tests:
Figure 6. Test example for type “stats”, query on Redshift
Figure 7. Test example for type “count”, query on Redshift
Figure 8. Test example for “stats”, query on S3
Test config filename should be placed somewhere our CI/CD can pick it up and copy it to a dedicated folder on S3 which can later be picked up by our DQ Framework’s Glue job.
DQ Framework Glue job logic
Relevant input parameters:
Glue job logic consists of these steps:
The results
Here’s an example of how the results of tests can be consumed:
SELECT *
FROM dq_results_db_qa.data_quality_check_results
where execution_date >= cast('2022-09-20' as date)
--and job_run_id = 'jr_5911116e3dafc555c71b605bfb98728ec8de5339788e81e3b3a25bb48594b179'
--and source_system_name = 'source_system3'
--and dq_group = 'fact-profiling'
order by execution_start_datetime desc , column_sort_order
limit 200 ;
Performance of data profiling
As established during preliminary tests, the performance is more impacted by the number of columns rather than the number of rows, because Spark can efficiently horizontally split the profiling work among its workers. In the tested scenario (about 40 tables, on average of 15 columns per table), the average querying + profiling time was 30 sec per table.
The largest amount of rows profiled was 105mil rows, in 194sec (3min). That was executed with G1 Spark Worker types (4xvCPU, 16GB RAM).
Conclusion
This is a very basic implementation of data quality and profiling framework, but implemented with a well-known technology among data engineers, so expansions to it can easily be done. Feel free to reach out if you have any questions regarding the implementation of the framework, and remember: happy coding!


