Benoit Boucher
DATA ENGINEER
How datacentres nevertheless impact the environment
In the last article, we talked about the means implemented by datacentres and cloud providers to minimize their environmental impact. In this article we will list the criticisms that can nevertheless be made about this industry. Subsequently, because datacentres alone cannot be held as responsible for their environmental footprint, we will briefly talk about what policy makers, companies and of course data engineers are doing, or can do to minimize their environmental footprint too.
Criticisms about datacentres
Limits of the PUE
The metric that is often highlighted by cloud providers to emphasize the energy efficiency of their datacentres is the Power Usage Effectiveness (PUE, see previous article). This PUE was useful for some time but is now reaching some limits:
- The equation is focused on the electric consumption only. However, a considerable amount of water (directly and indirectly since electricity generation is also consuming water) is used for cooling. Water consumed by datacentres does not appear in the PUE. To tackle this, the Data Grid SUGGESTED to accompany the PUE with Water Usage Effectiveness (WUE) – the ratio of the annual water usage divided by the IT Equipment Energy – as early as 2011. Unfortunately, this WUE does not seem as popular as the PUE and LESS THAN A THIRD of datacentre operators are measuring water consumption despite the considerable amount of water that is consumed (as a medium-sized data centre (15 megawatts (MW)) uses as much water as three average-sized hospitals).
- The carbon intensity does not appear in the PUE. What is the CARBON INTENSITY? The carbon intensity is the amount of carbon dioxide being produced per unit of electrical energy generated. If you plug your datacentre this morning, it will consume an energy mix (nuclear, geothermal, coal, wind, solar, hydro, etc.) that will probably be different as if you plug it this evening. Some energies (coal, oil, natural gas) are emitting more carbon than some others (hydro, wind, nuclear). In 2010, GreenQloud (today Qstack) suggested to modify the PUE to include the carbon intensity, leading to the so-called Green Power Usage Effectiveness (GPUE). In the same year, the Green Grid also suggested to modify the PUE to include the carbon intensity leading to the so-called Carbon Usage Effectiveness metric (CUE). Similar to the WUE, none of these metrics became very popular and as heavily communicated as the PUE.
- The equation is also lacking the weather conditions at the location of the datacentre. For two datacentres having the same efficiency and performances, one near the equator and one near the north pole, we should not expect the same PUE because the ambient temperature IS NOT THE SAME. Furthermore, climate changes – such as a heatwave or extreme cold – are also expected to influence the PUE, from one year to another, and so the PUE of a datacentre can be completely different depending on the extreme weather conditions.
For all these reasons, the PUE – which is a good, useful, and practical metric – should definitely not be considered as a whole but at least be enriched with other metrics or replaced by a more general metric which takes into account the aforementioned points. Finally, we can also note that the averaged global PUE STAGNATES. After having decreased from 2.50 to 1.65 from 2007 to 2013, the averaged global PUE was stagnant over the three last years (1.58, 1.67 and 1.59 for 2018, 2019 and 2020, respectively).
Embodied energy
The embodied energy of datacentre materials (IT materials and cooling materials) is also a source of carbon emissions. It goes along with indirect emissions (also termed SCOPE 3 carbon emissions). For example, if we consider the environmental footprint of the whole lifecycle of IT materials, we should consider:
- The extraction of the metals used in IT materials. The number and quantity of metals used in electronic components CONTINUE TO INCREASE as they become smaller and more efficient. The extraction and refining of those metals is DIRTY and can be dangerous for local populations.
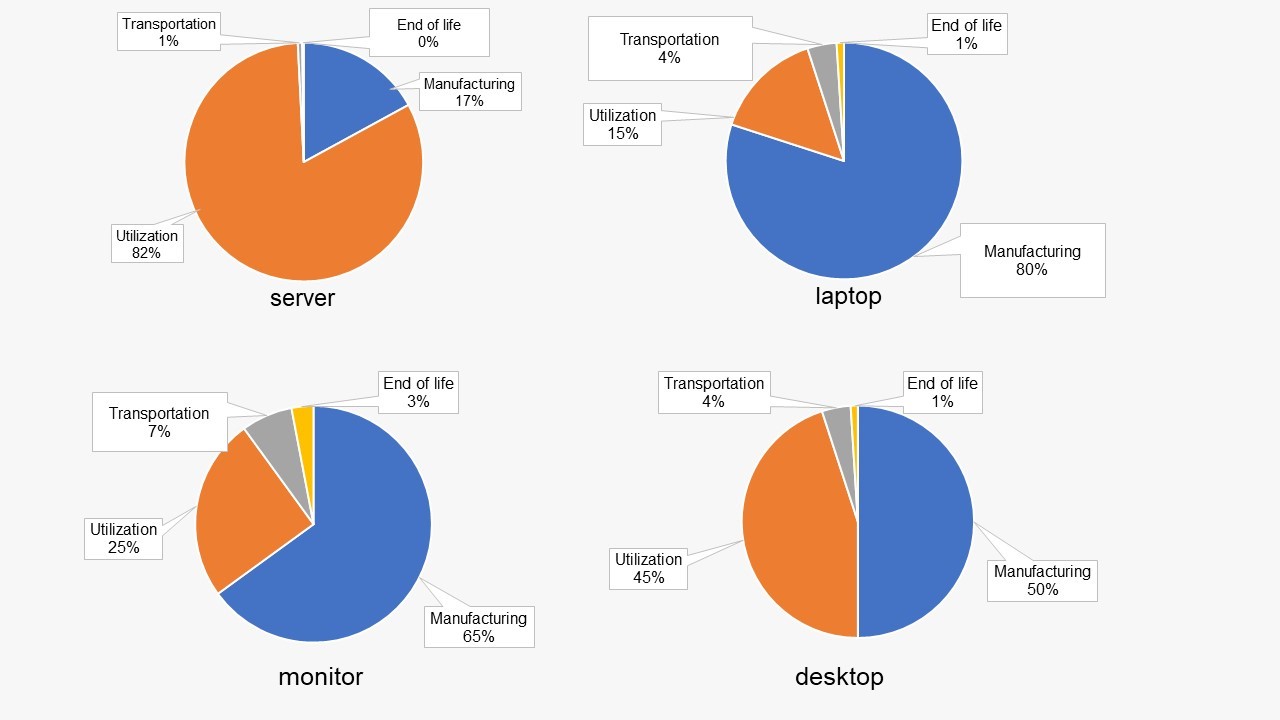
- The manufacturing of IT materials. For example, for a server that is used for 4 years (it is sometimes less in hyperscale datacentres, as mentioned in the last article), manufacturing accounts for nearly 10% of the carbon footprint of the product (see Figure 1). The remaining 90% are its utilization, transportation, and end-of-life. Note that for a laptop or a desktop – that are also found in datacentres – it is much more than 10%, as we will see later.
- The recycling or end of life of the IT material. In Europe for example, ONLY 18% of the metals in laptops are recovered
- The transportation between these three life periods of the IT Materials.
Figure 1: A rough estimation of the carbon FOOTPRINT of a server (top left), a laptop (top right), a monitor (bottom left) and a desktop (bottom right) for a lifetime of 4 years. Based on the Dell product carbon footprint analysis.
Over-provisioned datacentres
Another aspect of excessive energy consumption in datacentres is related to the “user tyranny”, the fear of disruption or outage which could result in BIG FINES for cloud providers. Anne-Cécile Orgerie – a computer science researcher at the Irisa, Rennes, France – remarked in a CNRS ARTICLE in 2018: “Despite numerous studies showing that this would not affect their performance, datacentres continue to operate at 100% capacity 24 hours a day […] The reason for this is that those in charge of the equipment will not risk users having to suffer from even the slightest latency—a lag of a few seconds.”
Datacentres can endanger the energy transition of some countries.
In Southeast Asia, some cloud providers are implementing new datacentres in countries which rely almost exclusively on fossil fuels like SINGAPORE or INDONESIA. While it is inevitable to implement new datacentres in the VALERIEPIERIS CIRCLE – a region containing more than half the world population – these implementations could put at risk the COMMITMENT of some of those countries to become carbon neutral.
In Europe too, the datacentre industry risks jeopardising the energy transition of some countries like IRELAND and NETHERLANDS.
The threat of a rebound effect
We noted in the last article that users could reduce their carbon-footprint by 88% by migrating their server performances to the cloud. However, not all users will effectively migrate all their server performances to the cloud and eventually close their own datacentre. Indeed, some users might prefer a hybrid approach: migrating partially to the cloud while keeping access on their own datacentre, on-premises. There are also some users who are willing to have a hybrid multi-cloud approach. There are already some solutions – such as Anthos – to monitor services spanning between clouds and/or on-premises. This poses the threat of a rebound effect.
What is the rebound effect (or Jevons paradox)?
The rebound effect is the increase of consumption of a resource, related to the reduction of the limits of this resource.
Example: high speed trains allow us to travel faster. Its rebound effect is that we spend the same amount of time using them, but we travel further.
Another example: 5G allows us to spend less energy for the same volume of communication. Its expected rebound effect is an overall increase of global communications.
Similarly, we could expect a rebound effect for the public cloud: it is less expensive, more secure and it reduces GHG emissions to move to the cloud. The rebound effect could be a larger utilization of datacentres than before or attracting new users who did not use datacentres previously.
And what if…
There are two reasons why energy consumption due to datacentres could rise exponentially in the next few decades:
- Currently, there is a compensation because on the one hand there is an increase in energy which results from users migrating to the cloud and closing their own datacentre (or considerably reducing its use) and on the other hand there is an increase in energy due to new users starting their business directly with cloud (no pre-existing datacentre) or users increasing their use of cloud computing. But at some point, when no more users will be migrating to the cloud, the energy demands for datacentres MAY RISE SIGNIFICANTLY.
- We mentioned in the beginning of the last article that the energy efficiency of servers is in constant growth. Nevertheless, the improvement of a server’s capacity is not expected to continue indefinitely, and a LIMIT MAY BE REACHED in the next decades either due to physical efficiency limits of transistors, or theoretical limits to Koomey’s law.
Finally, as a conclusion for this section regarding datacentres, it should be mentioned that recent studies analysing ICT or datacentres energy consumption call for more regulations from the policy makers. ARSHAD ET AL., MASSANET ET AL. or SANTARIUS ET AL. to name a few. For completeness – because not only datacentres and cloud providers should be held responsible for their success – we will also talk briefly about policy makers, companies, and data engineers.
Policy makers
We are not aiming to make a complete list of policy makers regulations in this section but only highlight a few promising ones regarding:
- The extraction of metals: since the 1ST OF JANUARY 2021, the E.U. requires European companies to ensure that their imports of minerals and metals are exclusively from responsible, conflict-free sources. Similar law exists in the U.S. since 2010 with the Dodd-Frank law.
- Manufacturing and end-of-life: as early as 1992, the U.S. put into place the Energy Star labelling program, aiming to encourage low-energy devices. In the E.U., since the 1ST OF MARCH 2021, there is a right to repair to extend the lifecycle of electronic devices
- GHG emissions: IN EUROPE, all datacentres should be carbon-neutral by 2030. As early as 2008, the E.U. also issued a CODE OF CONDUCT for datacentres. As part of the GREEN DEAL, E.U. has the ambition to become the first neutral carbon continent by 2050. On the other side of the world, in China – who announced to become carbon neutral by 2060, and although 73% of the electricity consumed by datacentres came from coal-fired power plants in 2018 – SOME CITIES started to ban (or will not give subsidies to) datacentres having that had too high of a PUE. More recently, under the impulse of BIDEN, the U.S. joined the Paris agreement.
We can also note that with countries passing data localization laws that require citizen’s data to be stored on servers located domestically more frequently (GDPR for EU, Personal Data Protection Law for China, Japan’s Act on Protection of Personal Information for Japan, etc.), using datacentres in colder climates, countries beyond these borders either bring an ADDITIONAL BURDEN or are simply not an option anymore.
Companies
We do not have enough hindsight to confirm that moving to the cloud will lower the environmental footprint for companies in the long term. For sure, migrating the servers’ performances to the cloud will lower the environmental footprint as mentioned above and in the last article, but as there are additional services in the cloud, the benefits obtained by moving to the cloud could be reinvested in implementation of new products, posing the threat of a rebound effect.
What we can say however, is to not migrate to the cloud alone and unprepared. Especially for companies that have large technical debt. We are not saying that because consulting is a part of the core business of Syntio, there is a technology gap between traditional IT infrastructure and clouds that should not be neglected as they could result in a large amount of waste. Meghan Liese – Senior Director Product Marketing from HashiCorp – pointed these challenges recently in an ARTICLE in The New Stack (as much as 40% of cloud spend is sunken into over-provisioned and unused infrastructure in many organizations).
Companies concerned about their environmental impact or willing to strengthen their image can get the ISO 14001 (on the environmental management system of a company), the Eco Management and Audit Schema EMAS (tightly linked to the ISO 14001) and finally the ISO 50001 (which certifies the energy performance of a company).
In contrast to servers, where we noted earlier that the carbon footprint of the manufacturing was smaller than the one of its utilization, the CARBON FOOTPRINT OF A LAPTOP is approximately 80% due to its manufacturing and 15% its utilization, for a 4-years utilization (its transportation and end-of-life account for the remaining percentages). The same trends are observed for monitors (~65% for (a 4-years) utilization) and desktop (~50% for manufacturing / ~45% for (a 4-years) utilization). See Figure 1. Because of the large contribution in the manufacturing to the environmental footprint of the product, it is an environmental choice for companies to keep the IT material for a few more years of utilization. As noted by the SHIFT PROJECT, the average respective lifetime of the items of equipment is estimated at 3 years for a laptop computer, and 2.5 years for a smartphone. We all know that we are often changing our smartphones while they are still working perfectly. Mottainai! (What a waste! As they say in Japan). By lengthening these lifetimes to 5 and 3.5 years, respectively, this could reduce the annual related GHG emissions of 37% and 26% per employee.
The Shift Project provides three more suggestions for companies:
- Companies could also offer to employees a “bring your own device” (BYOD) option, based on the utilization of smartphones equipped with two SIM cards. This would limit the number of terminals per person, and this is expected to reduce the annual related GHG emissions of 37% per employee.
- Favouring the exchange of office documents on a shared platform to reduce the number of copies of the same document stored on the servers used by the company, and avoid documents shared by email resulting into duplicated documents is also expected to have a considerable impact on the environmental footprint of the companies.
- In the same way as financial and social criteria, indicators of the environmental impact of digital components of a product could be included during the elaboration of a project or product.
Data engineers
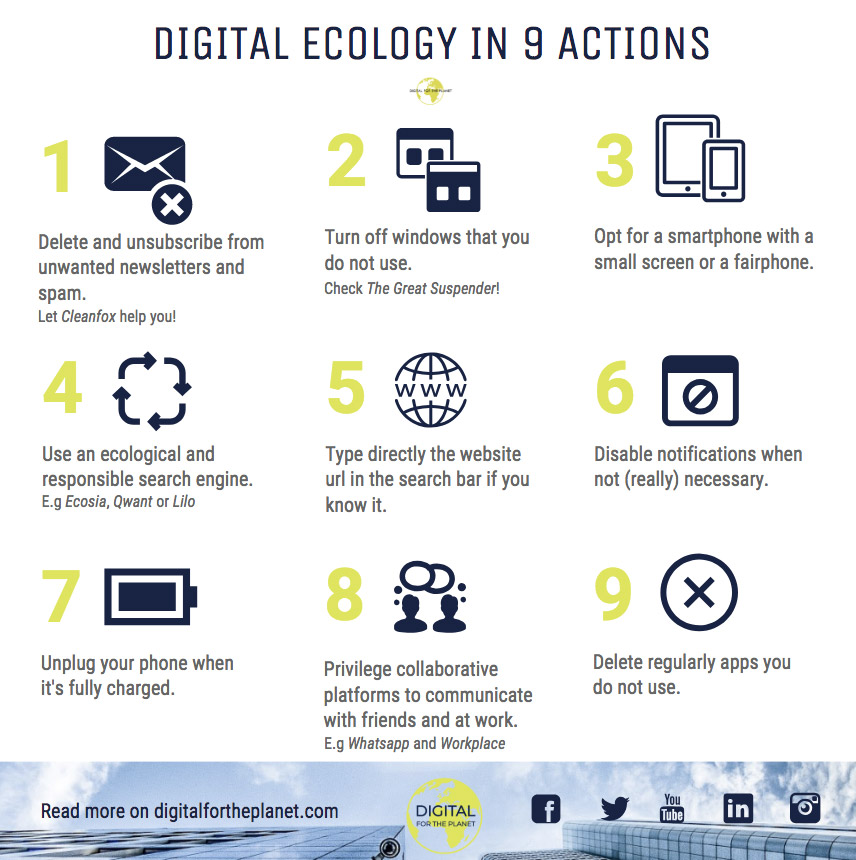
Data engineers are individuals before data engineers. Like everybody, they can be concerned about the digital sobriety or digital frugality or whatever you call it. Ines Leonarduzzi – author of Réparer le future (Editions de l’observatoire) – with her NGO Digital for the Planet suggests the following actions in Figure 2.
Figure 2: Actions SUGGESTED by the NGO Digital for the Planet to reduce our digital footprint.
We would like to add, especially because we did not say a lot regarding network, which accounts for nearly 40% of electricity consumption as mentioned in the previous article, and also because videos are accounting for a LARGE MAJORITY (~80%) of the network:
- using a music platform instead of a video platform to listen to music (if you are seeking for new inspiration, check out our SYNTIO PLAYLIST,
- reducing the quality of videos wherever possible (for example, you can pretty fairly watch the TOMO TALKS series with half of the best video quality without any problem enjoying it.
We will not extend the list further as many websites with good advice already exist like this. Let us instead focus on more technical and data engineering related topics. Here are a few things that data engineers can do to lower the environmental impact of their work:
- While it is more practical to start a product with a monolithic application, it becomes more relevant to break it down in favour of a distributed architecture – such as microservices or even a domain-oriented architecture like the data mesh architecture BROUGHT FORTH recently by Zhamak Dehghani from ThoughtWorks when scaling up. Indeed, microservices being independent from each other and loosely coupled (with MESSAGE BROKER for example) over time it is easier to rework a microservice while it BECOMES A BURDEN (became too big, scaling issues, applying changes become slow, the quality of the code declines, etc.) for a monolithic architecture. Our Syntio colleagues Martina Kocet and Tihana Britvic provided a list of reasons why moving to a data mesh architecture is a positive thing in a SEPARATE ARTICLE.
- Whenever possible, select availability zones in public cloud that have a low PUE and or a low carbon intensity. Some clouds have provided calculators to quantify the carbon impact of their CLOUD SERVICES or DATACENTRE LOCATIONS.
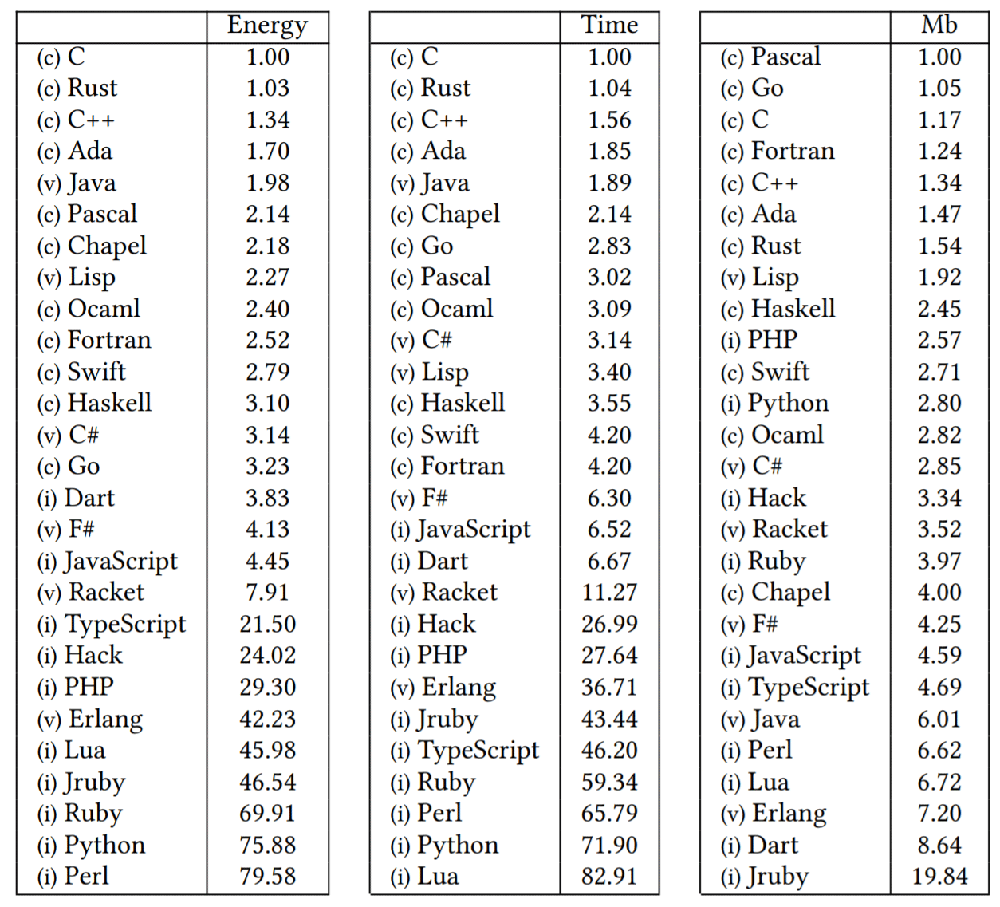
- Using a language with good energy, time, and memory efficiencies (see Table 1 From PEREIRA ET AL.. For example, if you need to use a function as a service (FaaS), as in most of the clouds you have the choice between several languages, for better energy saving, time saving, and energy efficiency. You may wish to use Go or Java instead of Python or Ruby, but of course, those languages also compare themselves differently (functional, imperative, object-oriented, scripting) and there may be architectural decisions or company choices that influence the choice of a language. ABOUT TEN YEARS AGO, a social network for professionals improved their product to be 20 times faster for some scenarios and use 3 servers instead of 30, simply by replacing their language from Ruby to Node.js.
Table 1: Benchmark of energy, time, and memory efficiencies of different languages.
Continuously improving data engineering skills. Writing codes that optimize the memory, the time and the energy whilst running is done with experience. Anne-Cécile Orgerie remarked in the same article that we mentioned earlier “Back in the days when memory capacities were limited, software developers were accustomed to writing concise, efficient code. Now that this is no longer an issue, we are seeing a definite inflation in the number of lines of code, which means longer calculations that use up more electricity.” Today, we do not need to write optimized code by constraint, but we can do it by choice. To write good code, we need to learn and improve our skills. If you follow our Syntio communications, you may have noticed that we have a culture of sharing (like HERE, HERE, HERE, and HERE). We also give the opportunity to complete globally acknowledged certificates with the support of our company.
Conclusion
Let us conclude this series of articles. It is up to everyone to either wait and see what could happen: will cloud providers keep all their promises? Will policy makers establish more policies? Will companies take more actions to reduce their environmental footprints? Or alternatively, it is up to everyone to take some action at their own level.
As our final word, we will share the story of the hummingbird that was POPULARIZED by the Nobel Peace Prize winner Wangari Maathai.
This is the story of a forest that caught fire. It was a huge fire, and it was raging, and all the animals came out of the forest and stood by the edge of the forest. And they are watching the fire. They were very overwhelmed. They were powerless. They felt like there was nothing they could do because the problem was too much for them. Except this little hummingbird. The hummingbird said, “I am going to do something about the fire.” So, it flew to the nearest stream, took a drop of water and flew back and put it on the fire. Then, back again, brought another drop of water and put it on the fire. And it kept going as fast as it could. In the meantime, all these animals are discouraging it and are persuading it not to bother because it is too little: “your beak is too little, you are bringing very little water.” And some of the animals that are talking like that are the elephants with big trunks which could bring much more water. But the hummingbird just kept doing what its new best without wasting any time. And to stop them, when they said, “what do you think you are doing?” the hummingbird said, “I’m doing the best I can.”
Acknowledgements: many thanks to Emma Robinson and Tanja Juric Klaric for refining the narrative and the layout of the articles.


