Benoit Boucher, Filip Milic
DATA ENGINEERS
You want to create a custom alert on Stackdriver for one of your DAG in Composer Airflow? You have heard about logging and monitoring but you don’t really know how to do that? If the answers are yes, check out this blog post!
Picture a scenario:
-
You are working on GCP.
-
You want to create a custom alert on Stackdriver for one of your DAG in Composer Airflow.
-
You have heard about logging and monitoring but you don’t really know how to do that.
If this applies to you, then you’ve come to the right place! This tutorial will help you with just that!
Prerequisites:
-
Google Cloud Project
-
A Composer environment
For the purposes of this tutorial, we will be working on a Composer environment namedcomposer-log-error-example. Note that its location is set toeurope-west1.
PART 1 – CREATING THE ERROR LOGS IN COMPOSER
In the following example, we will make use of the Logging Client Library (already installed in Composer).
Here is a script example:
Explanation of some of the more notable points
""" Send a log which should appear as an Error """ import datetime from airflow import DAG from airflow.operators.dummy_operator import DummyOperator from airflow.operators.python_operator import PythonOperator from google.cloud import logging from google.cloud.logging.resource import Resource default_args = { 'start_date': datetime.datetime.now(), 'retries': 5, 'retry_delay': datetime.timedelta(minutes=5), 'dagrun_timeout': datetime.timedelta(minutes=30) } dag = DAG( 'test_logs_error_text', default_args=default_args, max_active_runs=1 ) start = DummyOperator(task_id='start', retries=1, dag=dag) end = DummyOperator(task_id='end', retries=1, dag=dag) def write_logs(): client = logging.Client() log_name = 'airflow-worker' logger = client.logger(log_name) error_gcloud_log = 'This_is_an_error in the google cloud log!' log_resource = Resource( type='cloud_composer_environment', labels={ 'location': 'europe-west1', 'environment_name': 'composer-log-error-example' } ) logger.log_text(error_gcloud_log, severity='ERROR', resource=log_resource ) run_py = PythonOperator( task_id='run_py', python_callable=write_logs, dag=dag) start >> run_py >> end dag.doc_md = __doc__ client = logging.Client() # Instantiates a client. log_name = 'airflow-worker' # The name of the log to write to. # Composer produces the following logs: # airflow: The uncategorized logs that Airflow pods generate. # airflow-database-init-job: The logs Airflow database initialization job generates. # airflow-scheduler: The logs the Airflow scheduler generates. # airflow-webserver: The logs the Airflow web interface generates. # airflow-worker: The logs generated as part of workflow and DAG execution. # cloudaudit.googleapis.com/activity: The logs Admin Activity generates. # composer-agent: The logs generated as part of create and update environment operations. # airflow-monitoring: The logs that Airflow monitoring generates. logger = client.logger(log_name) # Gets the client’s logger with the chosen name. error_gcloud_log = 'This_is_an_error in the google cloud log!' # The message that will be written in our error log. log_resource = Resource( type='cloud_composer_environment', labels={ 'location': 'europe-west1', 'environment_name': 'composer-log-error-example' } ) # Here, we’ve specifying information about the resource: its type, location and name. # If not specified, the log will be visible in Global resource only. logger.log_text(error_gcloud_log, severity='ERROR', resource=log_resource ) # Writes the log entry. # While we’re on the subject, it’s worth mentioning that we have a few different levels of severity at our disposal: # DEFAULT: The log entry has no assigned severity level. # DEBUG: Used for debugging or tracing information. # INFO: Denotes routine information, such as ongoing status or performance. # NOTICE: Usually used for normal but significant events, such as start up, shut down, or a configuration change. # WARNING: Warning events might cause problems. # ERROR: Error events are likely to cause problems. # CRITICAL: Critical events are almost definitely causing severe problems or outages. # ALERT: Signals that action must be taken immediately. # EMERGENCY: The highest level of severity; means that or more systems are flat-out not functioning.
As a side-note, if you’re looking for a bit more structured logs, instead oflog_text, you may uselog_struct:
logger.log_struct({ 'message': error_gcloud_log, 'custom_key': 'value_pair' }, severity='ERROR', resource=log_resource )
Put your script in the DAGs folder and trigger your DAG.
Results
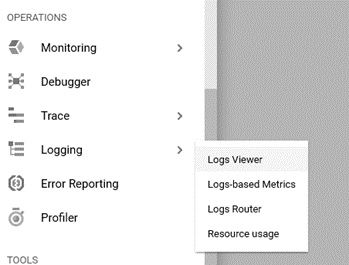
Go to Logging>Logs Viewer:
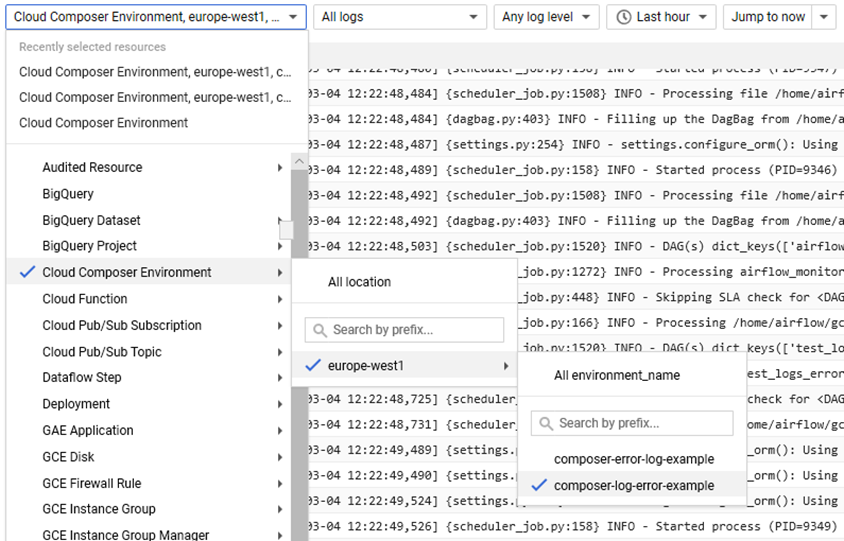
Select the Cloud Composer Environment resource, then the europe-west1 location and, finally, the name of the composer environment: composer-log-error-example.
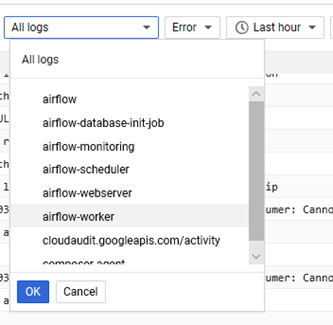
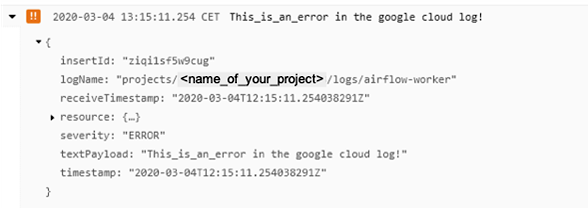
In the second tab, select the airflow-worker logs. In the third tab, select Error.
Your error should appear in the logs.
PART 2 – CREATING AN ALERT SYSTEM ON STACKDRIVER
Great! We’ve now learned how to file our custom error logs. However, periodically checking the Log Viewer for them is hardly efficient. It’d be great if we could somehow create a notification system that triggered whenever they occurred.
To do this, we will first have to create ametric. A metric will keep track of the number of logs in our composer’s error log.
On the same page as before, and using same filters as before, click on the Create metrics button (top of the page).
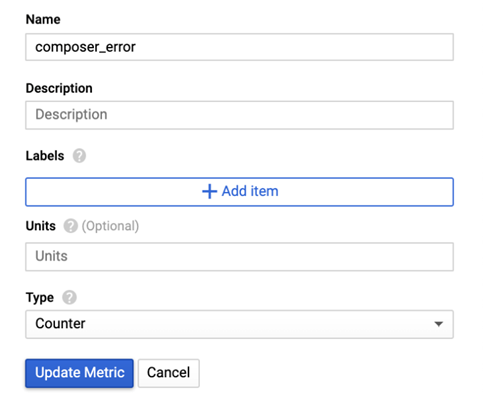
Give your new metric a name, a description, labels and units. For the type, select Counter. Then click on Update Metric.
We will now create analertbased on our new metric.
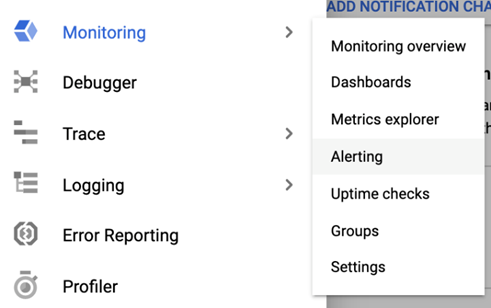
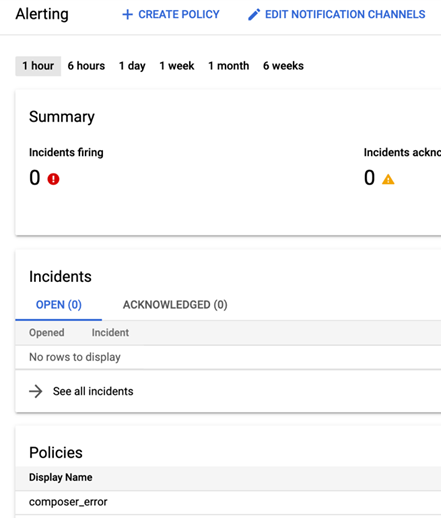
First go to Monitoring>Alerting:
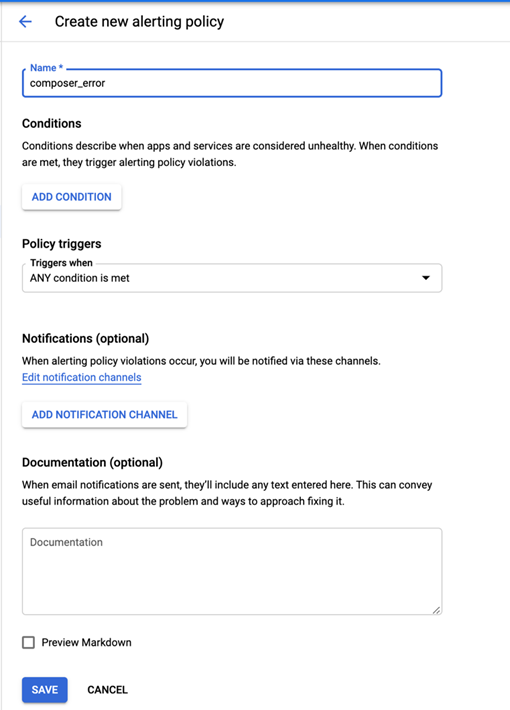
Click on create policy. Give a name to your new alert and click on Add Condition.
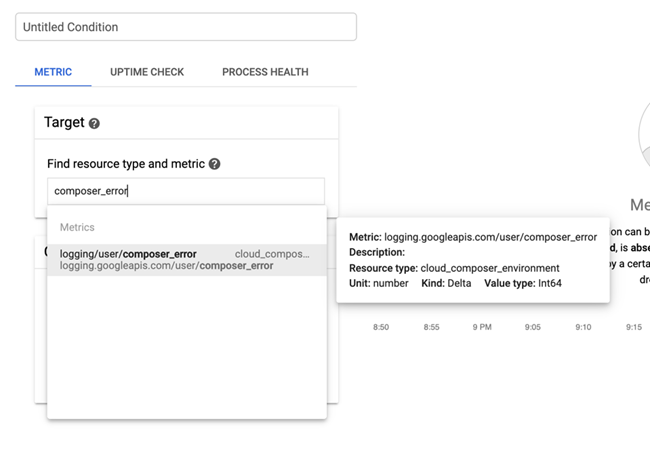
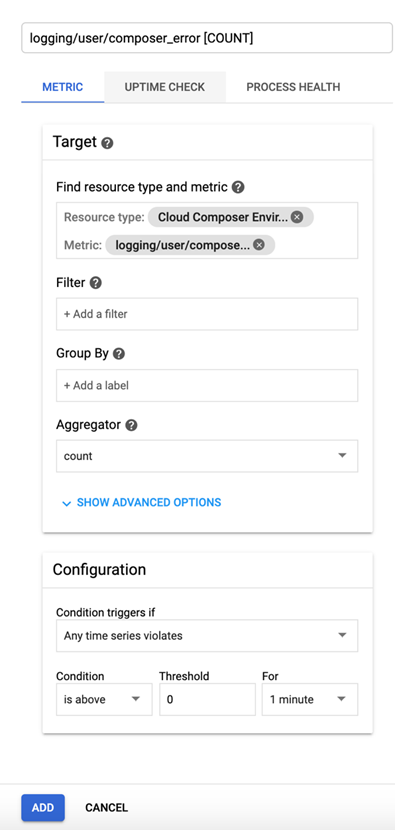
Write the name of your metric in Target. In our case, we will be looking for ‘composer_error’.
This will now search for all ‘clouderam’ hosts that end with numbers from 01 to 02 and all ‘clouderaw’ hosts that end with numbers from 01 to 05. That would be all our VMs.
Click ‘Search’.
If done correctly, the search will find our 7 hosts:
Click ‘Continue’.
On the next screen leave everything as is, just under ‘Additional Parcels’ choose KAFKA (at least we did):
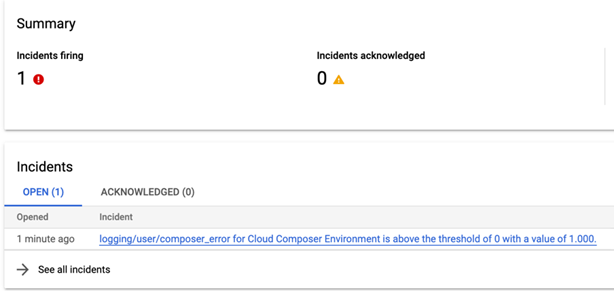
Test it! Trigger your DAG again.
After 1-2 minutes, an incident should appear in the alerting page.
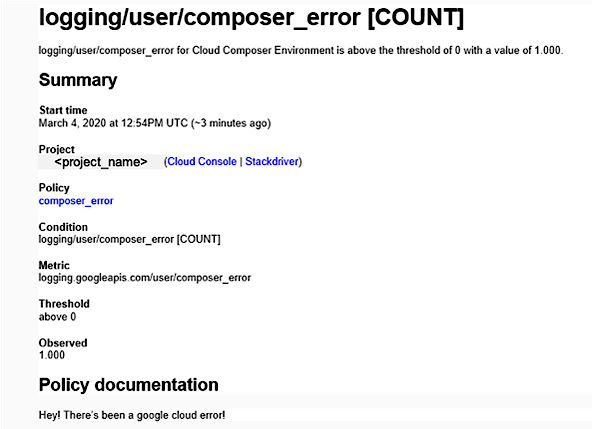
If you had set up an e-mail notification, you should also receive something like this:
Conclusion
We’ve shown how to easily create some error-type logs for Composer. In addition, we’ve demonstrated how to use logging and monitoring to create an alert policy for them in Stackdriver.
What’s next?
To go further:
-
GCP Official documentation:
HEALTH CHECKING YOUR CLOUD COMPOSER ENVIRONMENT
-
GCP GitHub repository with examples:
PYTHON DOCS SAMPLES– Connect to Preview
-
google-cloud-logging library information:
PYTHON CLIENT FOR CLOUD LOGGING (we recommend THE FOLLOWING GUIDE)
