Jakov Vidulic, Marko Jelovic, Dino Sehic
DATA ENGINEERS
Usually, when you start working on a new job, you don’t expect to get immediate hands-on experience during the first few weeks. Well, little did we know.
The first day we embarked as newbies (7 of us) on the Syntio journey, we were introduced to our onboarding introduction presentation and – a project. And it was not a dummy one. The goal of the project was to help gather insights of data from selected social networks by automatizing data fetching from our official Company profiles, allowing us to have an easy overview of the data regularly. And we wanted to do it as if it was any other data engineering project: agile planning with sprints and daily coordination, task management, collaborative development, DevOps…everything.
INITIAL WORKFLOW
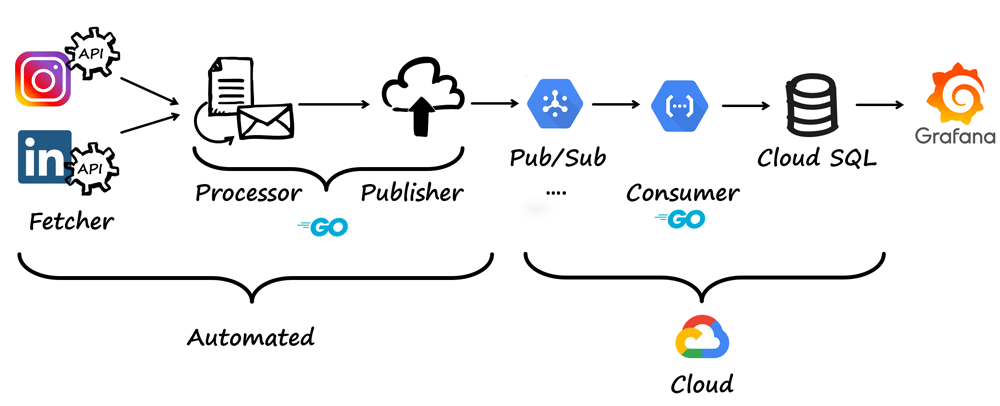
We got to plan and research the initial architecture proposal. The first planned workflow version can be seen below. To speed up the development process, we selected the most straightforward, affordable and doable architecture
The idea was to access the data of interest through the APIs of Instagram and LinkedIn. Once fetched, the data would be processed and published on Google’s PubSub platform where it would be later consumed and stored in a database using Google’s Cloud SQL. In the end, the stored data would be visualized using visualization apps.
In this blog we will go through the five phases of our project: fetching, processing, publishing, consuming and visualization.
API, Y R U inaccessible? or the FETCHING PHASE of the project
As already mentioned, the plan was to fetch the data using social networks’ APIs. With absolutely no obstacles in sight we searched for the LinkedIn API hoping to have the data in the next half an hour or so, but we found out that to access the data we had to apply for access and the application had to be approved.
So, we applied for it that afternoon and the following morning we got rejected.
As in many agile data engineering project scenarios, a change of architecture and approach was ahead of us. Embrace the change, right? So, we managed to collect the data we needed using other tools.
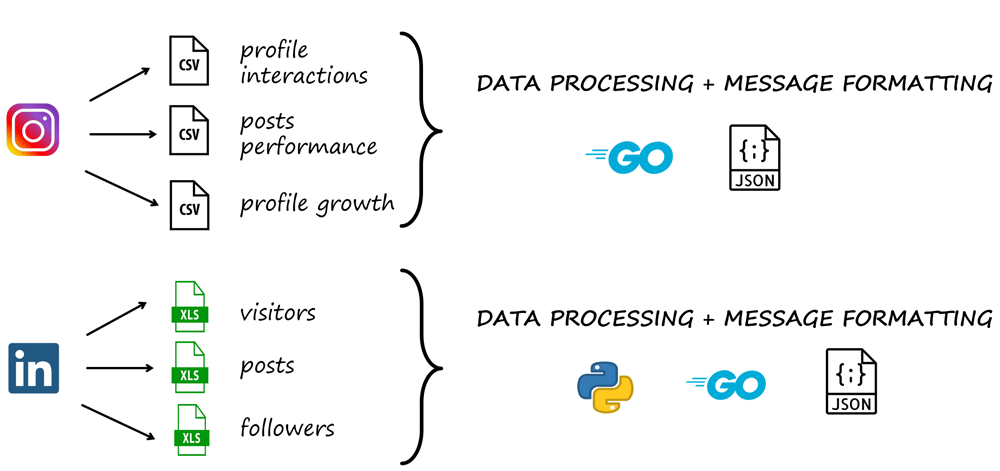
For our LinkedIn profile, we were able to export the statistics on visitors, followers, and updates (posts) in a preferred time window.
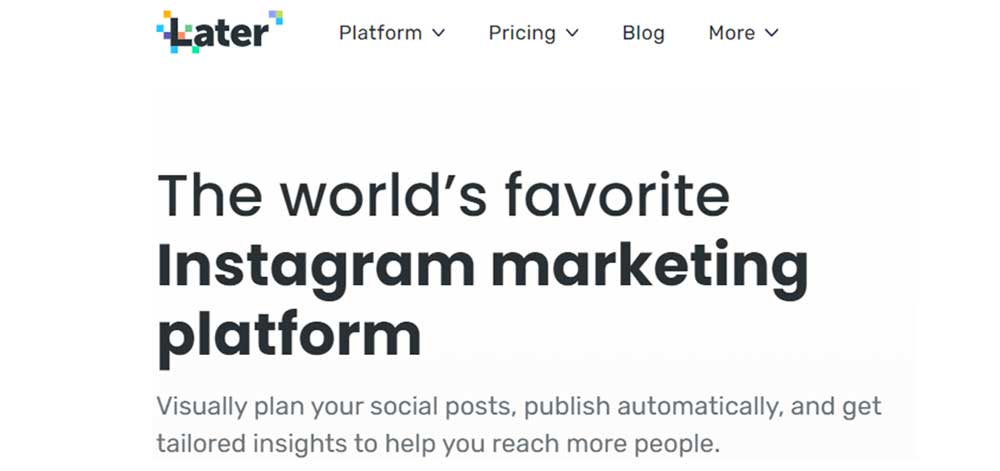
As for Instagram, we got the data through the Later marketing platform. It enables anyone with admin rights on an Instagram profile to export statistics on post-performance, profile interactions, profile growth and discovery and others.
PROCESSING PHASE
Most of the processing phase was done in Go language. Go (or Golang) is designed to be a fast and efficient programming language. Due to its lightweight architecture, concurrency superiority, and ease of deployment, it is predominantly used in Syntio product development.
Data from the Instagram profile is collected in the form of .csv files and the files were processed using Go with its CSV package.
Data fetched from LinkedIn is contained in legacy .xls format which no Go package was able to process successfully so the data was processed using Python’s xlrd package.
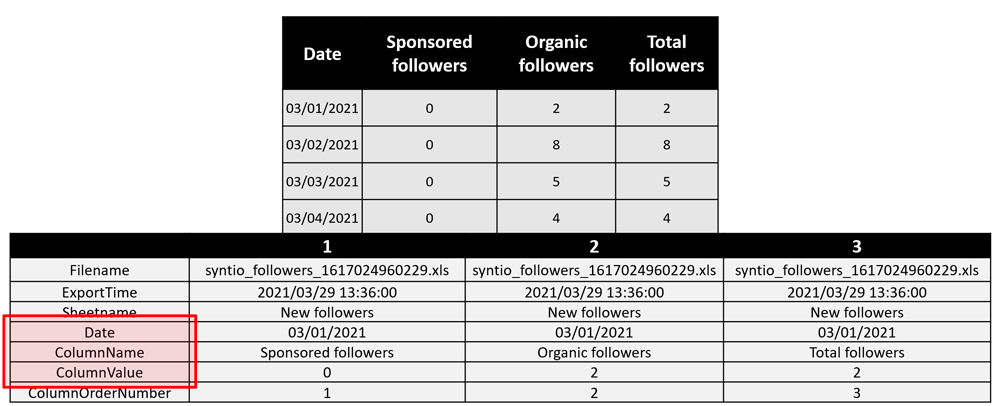
A major part of the processing work was the unpivoting of columns into rows. This was done because we wanted to standardize the output data so that in case of any column change on the source side, our pipeline and destination would not be affected as opposed to the scenario when we map the column names from CSV/Xls files to attributes of the database. Below is an example.
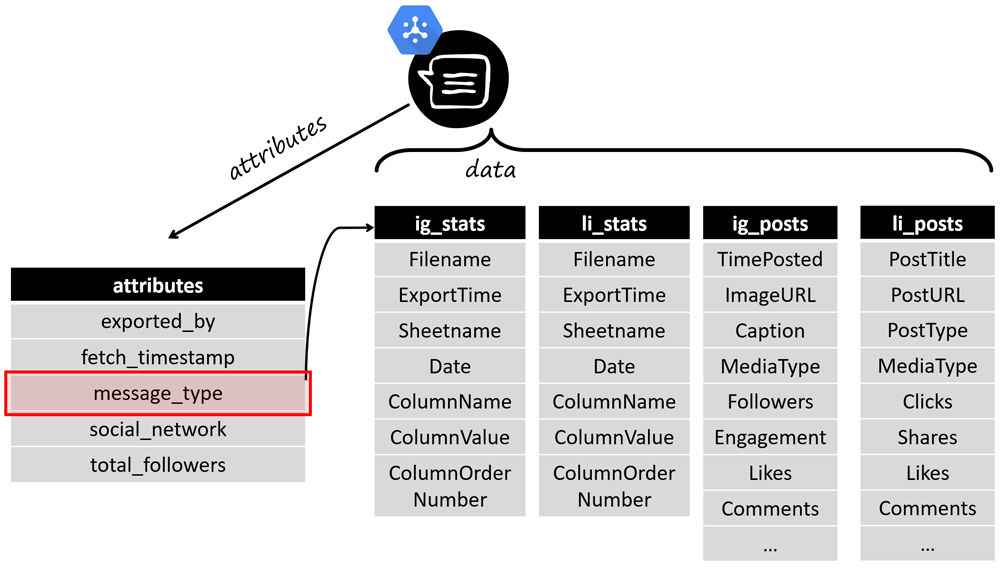
The last part of this phase was the formatting of the PubSub messages. Every PubSub message is defined by its attributes and its data. The data of our messages are stored in JSON format, and all our messages have the same attributes.
Of the five attributes (on the picture below) we point out the message_type attribute on which the data of the message depends on. The standardization of the statistics data can be seen for both Instagram and LinkedIn.
Now that all our files are processed and turned into messages, we are ready for publishing!
PUBLISHING PHASE
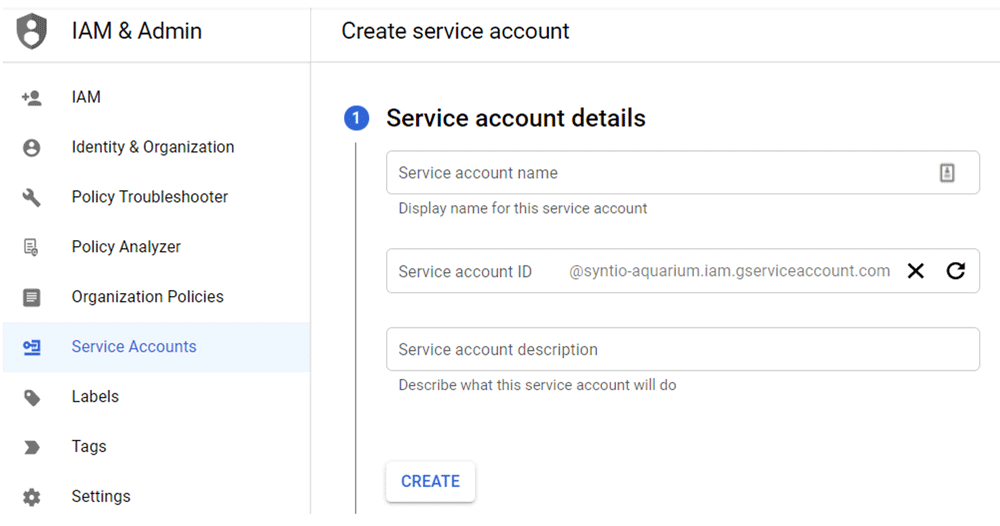
For the publishing part, we created a dedicated service account for authorization on GCP (Google Cloud Platform) and granted it the PubSub Publisher role.
Once created, we downloaded the .json credentials file that is being passed to the NewClient method to simplify the authentication process.
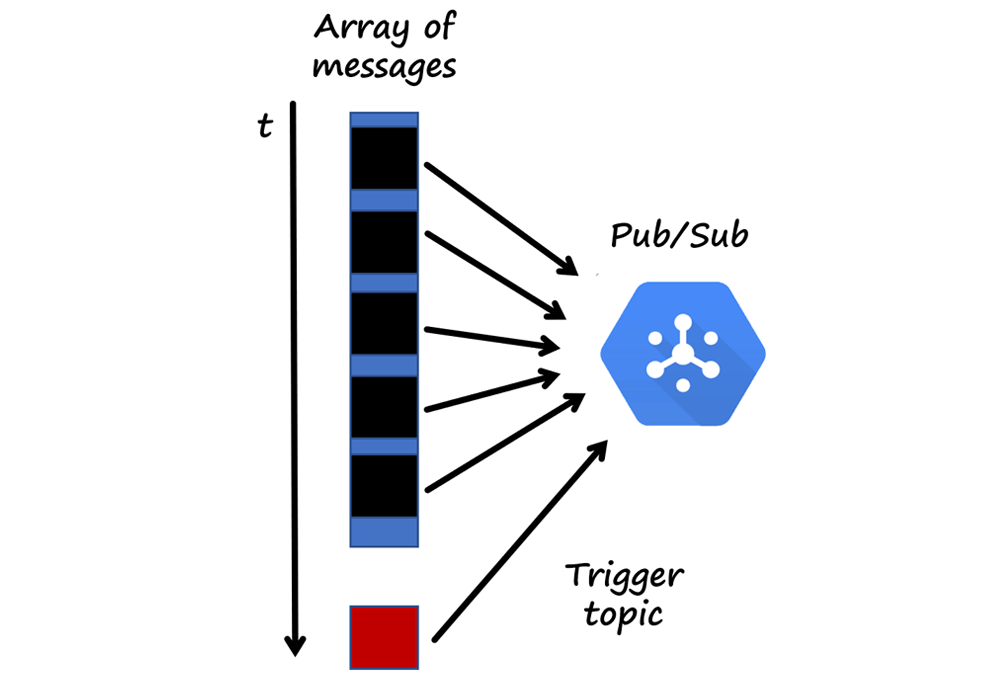
We use a two-topic mechanism. We publish messages one by one from an array of previously created messages to the message data topic. On the trigger topic, a single message is sent indicating that all data is sent.
When we first published our messages on the Pub/Sub we noticed some paranormal activity in the form of doubling and losing messages
After pondering for a while over the cause of this phenomenon, we figured out that one of the messages we were sending was over 500kB. After breaking that message into smaller messages of size 10kB the unusual behavior on the Pub/Sub was gone. Important lesson learned.
Oh, did you know Syntio has developed a product dedicated to solving the cost-efficient persistence of messages coming from any well-known message brokers. It backups all your incoming producers’ data and gives you peace of mind. It’s even open-source! Be sure to check it out.
CONSUMING MESSAGES
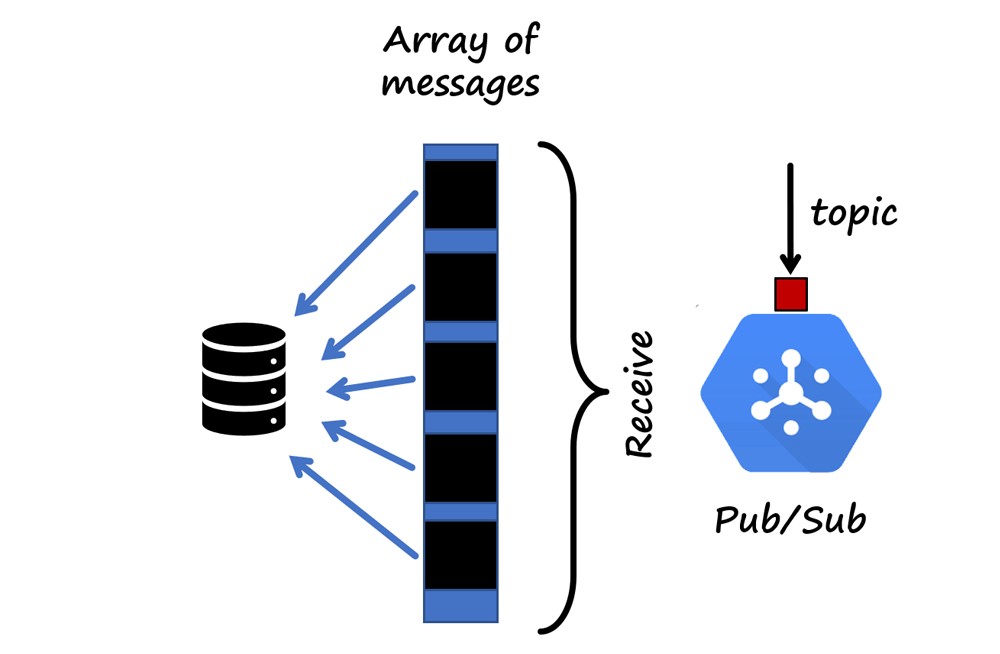
The next stage is retrieving messages from GCP Pub/Sub – developing a consumer and saving them to the Postgre SQL database. Our consumer was designed to be a cloud function on GCP. Since we wanted to control how the messages are being consumed and also be able to acknowledge them once the entire process is finished, we used a two-topic approach with a combination of push subscription and pull subscription, one is to trigger a process, and the other does the processing of the messages.
Alternatively, if we used only push to retrieve messages, there would be a possibility of losing that message within the process of formatting and saving it to the database. With a pull subscription, we have control over the Ack command, and we control the timing of confirming the successful retrieval and saving of the message. Therefore, we use the push benefit only as a trigger, where we will be notified that a message has been published, and the pull-based cloud function itself will accept that message and save it to the database. After the messages are pulled and saved into Postgres DB, the cloud function is done.
DESTINATION DATABASE
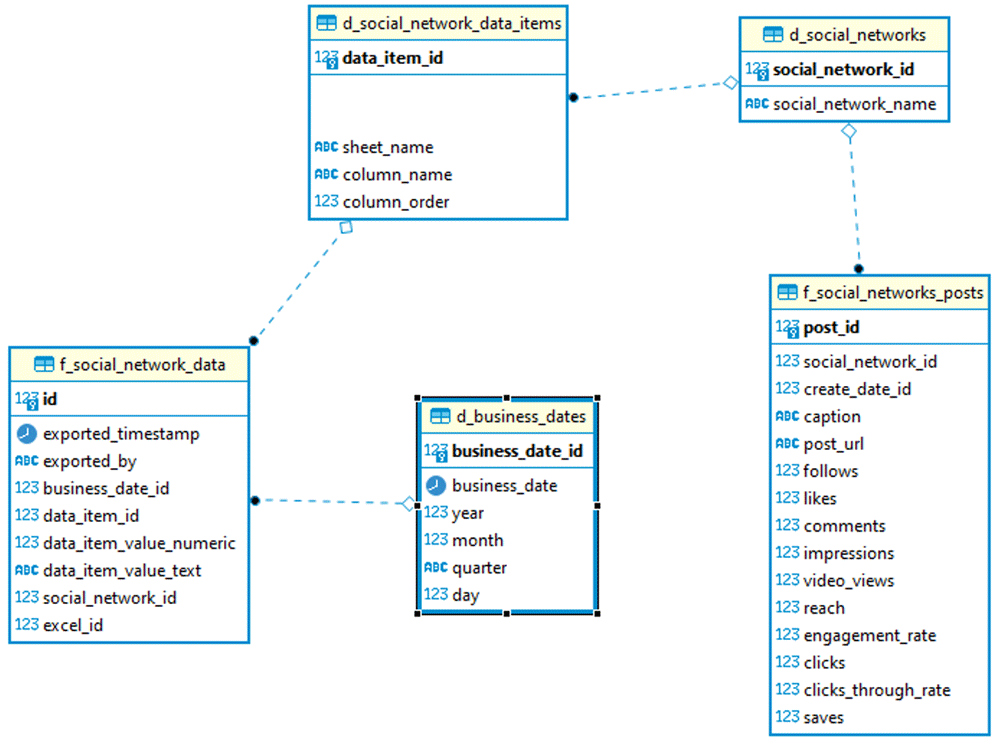
The destination Data Warehouse database is a relational Postgre DB running on Azure Virtual Machine. Model is common to analytical processing with dimensions and fact tables.
DEVOPS
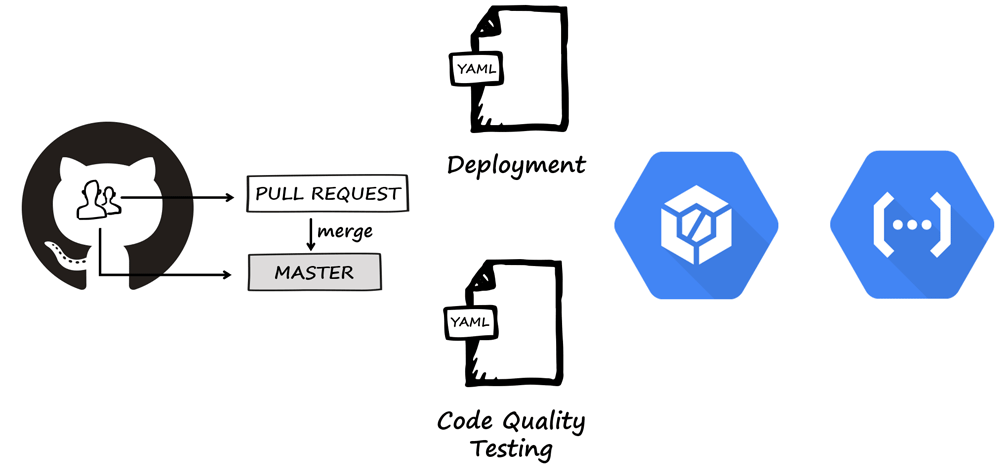
An important part of the project was to automate deployments and iterative development, a CI/CD pipeline. The task was solved using Cloud Build and two YAML files. Two triggers were made on Cloud Build, one for each YAML file. The first trigger was made to listen for any pull request made on our GitHub repository, and when a pull request was made, it would run the code quality testing YAML file. The second trigger runs the deployment YAML whenever a push to a master branch is made. Deployment YAML is designed to publish only a certain directory (consumer directory) to Cloud Functions.
The idea behind adding a CI/CD pipeline to this project was to make the implementation and deployment of the code seamless, faster and easier. It also provides us with instant feedback to reviewers who are responsible for merging pull requests.
VISUALIZATION
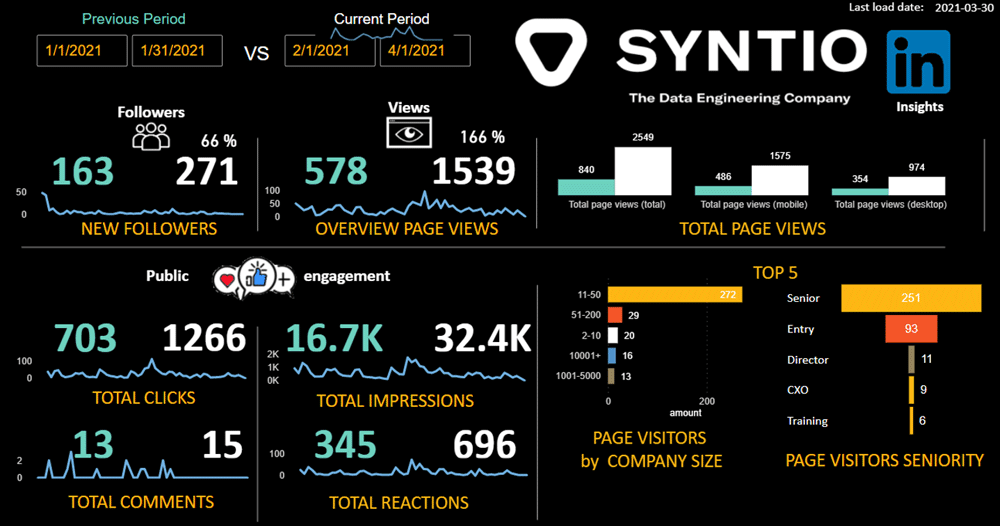
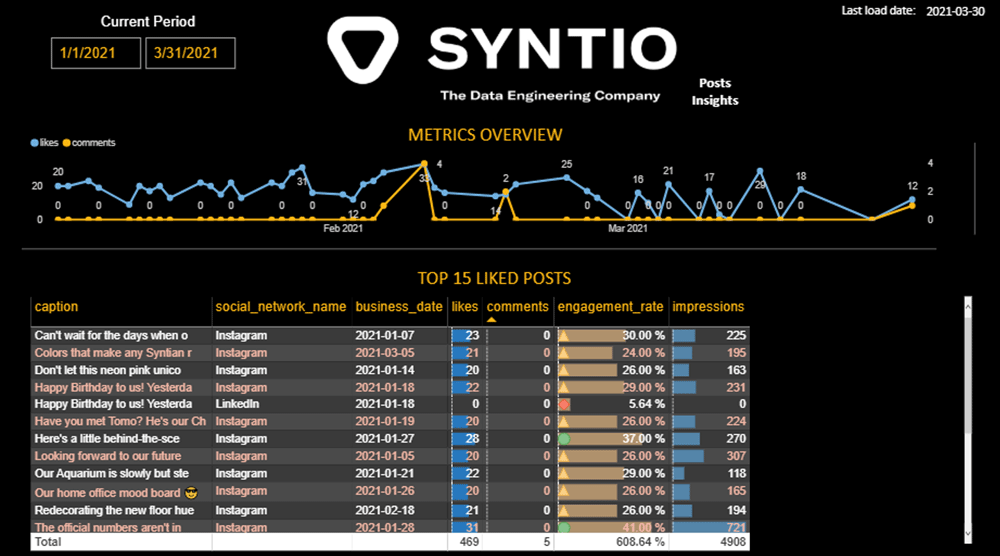
The fun part, seeing the results of the project! For the visualization of our data, we eventually chose well-known tools like Power BI and Excel. In Power BI we created a dashboard that contains many analytics data, such as follower count, comments count and engagement, which can be filtered by the date period (previous and current period). On the other view, we can see data corresponded with social network posts. The first image shows an overview of likes and comments metrics over time. On the bottom part of a view, we can see the overview of our TOP most liked posts on social networks.
Note: Actual values are mocked, for presentation purposes only
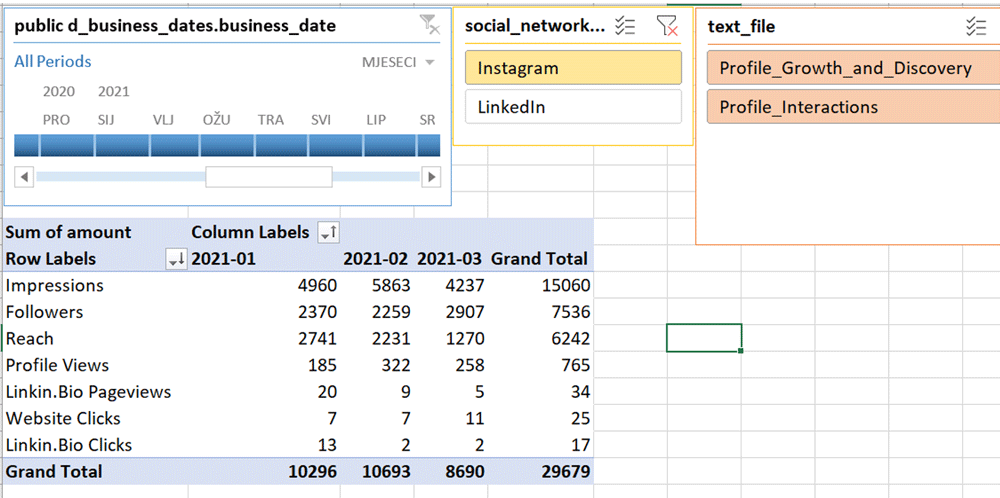
If we need to do more row-level analytics, we can now also use Excel for a quick and easy data overview or deep dive. Easy and fast filtering can be applied instantly.
CONCLUSION
The end goal of this project was to provide insights of data gathered from selected social networks (LinkedIn and Instagram) as well as providing easy access to both raw and aggregated visualization data – ready to be consumed. This can make a significant impact on our future activity on social networks. Now we can see the patterns in which our posts and activity influence our followers/viewers and adapt them to make an even more impact and present ourselves in better light to the public.
This work is a repeating cycle of iterative data-loading and as social network activity grows, this solution will always have space for improvement and upgrading. We would like to incorporate other social networks’ data and learn about new things linked with consumer activities by analyzing new data.
Working as a group in this initial phase provided us with some basic data engineering principles, skills, tools and technologies and overcome challenges.
This is only the beginning.

